


What is a Balance Sheet? A Simple Explanation: Understanding a company’s financial health often begins with grasping the concept of a balance sheet. Think of it as a snapshot of a company’s assets, liabilities, and equity at a specific point in time. This crucial financial statement provides valuable insights into a business’s financial position, allowing stakeholders to assess its solvency, liquidity, and overall financial strength. We’ll explore the key components, how to interpret the data, and some of its limitations.
This explanation will demystify the balance sheet, breaking down its core elements into easily digestible pieces. We’ll cover the three main sections—assets, liabilities, and equity—providing clear examples and illustrations to help you confidently navigate this fundamental financial report. By the end, you’ll possess a solid understanding of how to read and interpret a balance sheet, empowering you to make more informed decisions.
Introduction to the Balance Sheet
A balance sheet is a fundamental financial statement that provides a snapshot of a company’s financial position at a specific point in time. It’s essentially a summary of what a company owns (its assets), what it owes (its liabilities), and the difference between the two (its equity). Understanding a balance sheet is crucial for anyone interested in assessing a company’s financial health and stability.
A balance sheet offers a clear picture of a company’s financial resources and obligations. It shows the resources available to the business to meet its short-term and long-term obligations and to fund its growth. Think of it as a photograph of a company’s financial standing on a particular date. It doesn’t show movement or change over time, just a static view.
The Purpose of a Balance Sheet
The primary purpose of a balance sheet is to show the financial position of a business at a specific point in time. This allows stakeholders, including investors, creditors, and management, to assess the company’s solvency (ability to pay its debts), liquidity (ability to meet short-term obligations), and overall financial health. This assessment is vital for making informed decisions about investing, lending, or managing the business. The balance sheet provides the foundation for analyzing other financial statements and understanding a company’s performance over time.
Definition of a Balance Sheet
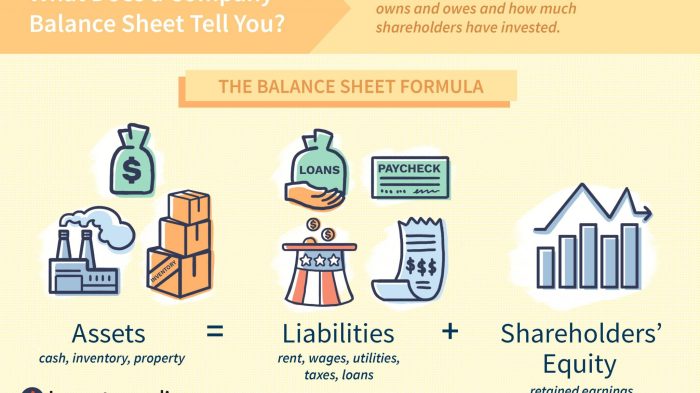
A balance sheet is a financial statement that reports a company’s assets, liabilities, and equity at a specific point in time. It follows the fundamental accounting equation: Assets = Liabilities + Equity. This equation highlights the core relationship between what a company owns, what it owes, and the residual value belonging to the owners.
Analogy for Understanding a Balance Sheet
Imagine you’re running a lemonade stand. Your assets would include the cash you have, the lemons and sugar in your inventory, and your lemonade stand itself. Your liabilities would be any money you owe, such as money borrowed from your parents to start the stand. Your equity is what’s left over – the value of your stand and supplies minus what you owe. The balance sheet for your lemonade stand would show a snapshot of these assets, liabilities, and your equity at a particular moment. This simple analogy mirrors the more complex balance sheets used by larger corporations.
Key Components of a Balance Sheet
The balance sheet is a fundamental financial statement that provides a snapshot of a company’s financial position at a specific point in time. Understanding its key components is crucial for interpreting a company’s assets, liabilities, and overall financial health. This section will break down the three main sections of the balance sheet and provide examples of accounts found within each.
The Three Main Sections of a Balance Sheet
The balance sheet is structured around three core components: Assets, Liabilities, and Equity. These three elements are intrinsically linked, and the fundamental accounting equation,
Assets = Liabilities + Equity
, underpins the entire structure. This equation highlights the relationship between what a company owns (assets), what it owes (liabilities), and the residual interest belonging to the owners (equity).
Characteristics of Assets, Liabilities, and Equity, What is a Balance Sheet? A Simple Explanation
Each section of the balance sheet possesses unique characteristics.
Assets represent what a company owns and controls, and that are expected to provide future economic benefits. These can be tangible, like property, plant, and equipment, or intangible, such as patents or goodwill. Assets are typically listed in order of liquidity, meaning how quickly they can be converted into cash.
Liabilities represent a company’s obligations to others. These are debts or other financial commitments that must be settled in the future. Liabilities can range from short-term obligations, such as accounts payable (money owed to suppliers), to long-term debts, such as loans and bonds.
Equity represents the residual interest in the assets of an entity after deducting all its liabilities. It essentially shows the owners’ stake in the company. For a corporation, this includes contributed capital (money invested by shareholders) and retained earnings (accumulated profits that haven’t been distributed as dividends).
Examples of Balance Sheet Accounts
The following table illustrates examples of different account types found within each section of the balance sheet.
| Assets | Liabilities | Equity |
|---|---|---|
| Cash | Accounts Payable | Common Stock |
| Accounts Receivable | Salaries Payable | Retained Earnings |
| Inventory | Loans Payable | Treasury Stock |
| Property, Plant, and Equipment (PP&E) | Bonds Payable | Additional Paid-in Capital |
Understanding Assets: What Is A Balance Sheet? A Simple Explanation
A balance sheet presents a company’s financial position by categorizing its resources (assets) and how those resources are financed (liabilities and equity). Understanding assets is crucial to interpreting the overall health and potential of a business. Assets are anything a company owns that has value and can be converted into cash. They are typically listed in order of liquidity, meaning how quickly they can be turned into cash.
Assets are broadly classified into current assets and fixed assets. This categorization helps stakeholders assess a company’s short-term and long-term financial capabilities.
Current Assets
Current assets are resources expected to be converted into cash or used up within one year or the company’s operating cycle, whichever is longer. These assets represent a company’s short-term liquidity and its ability to meet immediate obligations. A healthy level of current assets is vital for operational efficiency and financial stability.
Examples of current assets include cash and cash equivalents (easily accessible funds), accounts receivable (money owed to the company by customers), inventory (goods available for sale), and prepaid expenses (costs paid in advance, such as insurance). For instance, a retail store’s inventory would consist of the clothes, shoes, and other items it has for sale, while its accounts receivable would be the unpaid bills from customers who bought on credit.
Fixed Assets
Fixed assets, also known as non-current assets, are long-term resources used in a company’s operations and are not expected to be converted into cash within one year. These assets provide a foundation for a company’s operations and contribute to its long-term value. They represent the company’s investment in its productive capacity.
Examples of fixed assets include property, plant, and equipment (PP&E), such as land, buildings, machinery, and vehicles; long-term investments in other companies; and intangible assets (discussed below). A manufacturing company’s fixed assets might include its factory building, production machinery, and delivery trucks. These assets are vital to its ongoing operations and contribute significantly to its overall worth.
Tangible and Intangible Assets
The distinction between tangible and intangible assets is critical in understanding a company’s asset composition. This differentiation highlights the different natures of assets and their impact on the balance sheet.
- Tangible Assets: These are physical assets that can be touched and seen. They have a physical presence and can often be easily valued. Examples include land, buildings, machinery, equipment, vehicles, and inventory.
- Intangible Assets: These are non-physical assets that lack a physical presence but still hold significant value. They are often harder to value than tangible assets. Examples include patents, copyrights, trademarks, brand names, goodwill, and software.
Understanding Liabilities
Liabilities represent a company’s financial obligations—what it owes to others. Understanding liabilities is crucial to interpreting a balance sheet because they provide a picture of a company’s financial commitments and potential risks. This section will delve into the two main categories of liabilities: current and long-term.
Current Liabilities
Current liabilities are debts and obligations that are due within one year or within the company’s operating cycle, whichever is longer. These are short-term obligations that require immediate attention from a company’s management team. Effective management of current liabilities is essential for maintaining a company’s short-term liquidity and operational efficiency.
- Accounts Payable: Money owed to suppliers for goods or services purchased on credit. Imagine a bakery buying flour from a supplier; the amount owed for the flour is an accounts payable.
- Short-Term Loans: Loans that are due within one year. This could be a loan from a bank to cover immediate operational expenses.
- Salaries Payable: Wages owed to employees but not yet paid. This represents the compensation owed to employees for work performed but not yet disbursed.
- Interest Payable: Interest accrued on loans or other debt obligations that is due within the next year. This represents the cost of borrowing money that has yet to be paid.
- Taxes Payable: Taxes owed to government agencies, such as income tax, sales tax, or property tax, that are due within the next year. This includes federal, state, and local taxes.
Long-Term Liabilities
Long-term liabilities are debts and obligations that are due beyond one year. These represent longer-term financial commitments and often involve larger sums of money. Understanding a company’s long-term liabilities is essential for assessing its long-term financial health and stability.
- Long-Term Loans: Loans with repayment terms extending beyond one year. A mortgage on a company’s building is a common example.
- Bonds Payable: Debt securities issued by a company to raise capital. Investors lend money to the company in exchange for periodic interest payments and the return of principal at maturity.
- Mortgages Payable: Loans secured by real estate. This could be a mortgage on a company’s factory or office building.
- Deferred Revenue: Payments received for goods or services that have not yet been delivered or rendered. For example, if a company receives payment for a subscription service covering the next year, the portion related to future months is considered deferred revenue.
- Pension Liabilities: Obligations to pay retirement benefits to employees. This is a significant long-term liability for many large companies.
Current and Long-Term Liabilities: A Comparison
The key difference between current and long-term liabilities lies in their maturity dates. Current liabilities are due within a year, while long-term liabilities are due beyond a year. This distinction is crucial for assessing a company’s short-term liquidity (ability to meet its immediate obligations) and its long-term solvency (ability to meet its obligations over the long term). A company with a high proportion of current liabilities relative to its current assets might face liquidity problems, while a company with a large amount of long-term debt might have difficulty meeting its long-term obligations. Effective financial management requires a balance between short-term and long-term financing strategies.
Understanding Equity

Owner’s equity represents the residual interest in the assets of a business after deducting its liabilities. In simpler terms, it’s the portion of a company’s assets that truly belongs to its owners. This is the amount the owners would receive if all the company’s assets were sold and all its liabilities were paid off. Think of it as the owners’ stake in the business.
Owner’s equity is a crucial component of the balance sheet, providing a snapshot of the company’s net worth from the owners’ perspective. A higher equity figure generally indicates a stronger financial position, while a lower figure might suggest potential vulnerabilities. Understanding equity is essential for assessing a company’s financial health and making informed investment decisions.
Retained Earnings’ Impact on Equity
Retained earnings are a significant component of owner’s equity. They represent the accumulated profits of a company that haven’t been distributed to shareholders as dividends. Essentially, these are the earnings that the company has reinvested back into the business to fund growth, expansion, or other operational needs. The more profits a company retains, the higher its retained earnings and, consequently, its owner’s equity. Conversely, if a company distributes a large portion of its profits as dividends, its retained earnings and, therefore, its equity will decrease. For example, a company that consistently generates high profits and reinvests them will show a steady increase in retained earnings and a corresponding growth in its overall equity.
The Accounting Equation
The accounting equation,
Assets = Liabilities + Equity
, is a fundamental principle in accounting. It demonstrates the relationship between a company’s assets, liabilities, and equity. Assets are what a company owns (e.g., cash, equipment, inventory), liabilities are what a company owes (e.g., loans, accounts payable), and equity is the owners’ stake in the company. The equation always balances because every asset acquired must be financed either through debt (liabilities) or through owner investment (equity). This fundamental equation ensures that the balance sheet always remains in balance, providing a consistent and reliable picture of a company’s financial position.
How to Read a Balance Sheet
Understanding a balance sheet requires a systematic approach. It’s not just about looking at the numbers; it’s about interpreting their relationships and drawing meaningful conclusions about a company’s financial health. This section provides a step-by-step guide to effectively analyze a balance sheet and extract key insights.
Analyzing a balance sheet involves a careful examination of its components and their interrelationships. We will look at how to interpret the data presented and identify potential strengths and weaknesses in a company’s financial position. The process is similar to assembling a puzzle, where each piece (asset, liability, equity) contributes to the overall picture.
Step-by-Step Balance Sheet Analysis
The analysis begins with a thorough review of each major section – assets, liabilities, and equity. This is followed by calculating key financial ratios to gain a deeper understanding of the company’s financial health. Finally, comparing the balance sheet data over time and with industry benchmarks provides crucial context.
- Review the Assets Section: Examine the composition of current and non-current assets. Look for trends in accounts receivable, inventory, and property, plant, and equipment (PP&E). High levels of inventory relative to sales could suggest slow-moving products or potential obsolescence. Similarly, significantly increasing accounts receivable may indicate difficulties in collecting payments from customers.
- Analyze the Liabilities Section: Scrutinize the mix of current and long-term liabilities. High levels of short-term debt relative to cash could indicate liquidity concerns. A large proportion of long-term debt might suggest a high level of financial risk. It’s important to note the terms and conditions of debt, such as interest rates and maturity dates.
- Examine the Equity Section: Analyze retained earnings and contributed capital. A consistent increase in retained earnings generally indicates profitability and financial strength. Conversely, declining retained earnings might signal losses or significant dividend payouts. A high level of contributed capital could suggest that the company has raised significant funds from investors.
- Calculate Key Financial Ratios: Several ratios derived from the balance sheet provide valuable insights. These include the current ratio (Current Assets / Current Liabilities), which assesses short-term liquidity; the debt-to-equity ratio (Total Debt / Total Equity), which measures financial leverage; and the quick ratio ((Current Assets – Inventory) / Current Liabilities), a more conservative measure of liquidity that excludes inventory.
- Compare to Prior Periods and Industry Benchmarks: Analyzing trends over time reveals changes in a company’s financial position. Comparing the company’s ratios to industry averages provides context and helps identify areas of relative strength or weakness. For example, if a company’s debt-to-equity ratio is significantly higher than its industry peers, it might suggest higher financial risk.
Examples of Key Financial Ratios
Financial ratios offer a quantitative assessment of a company’s financial health. Understanding these ratios helps in comparing the performance of different companies and tracking changes over time. They are not standalone indicators but are most effective when considered in context with other financial data.
| Ratio | Formula | Interpretation | Example |
|---|---|---|---|
| Current Ratio | Current Assets / Current Liabilities | Measures short-term liquidity. A higher ratio generally indicates better liquidity. | A current ratio of 2.0 suggests that a company has twice as many current assets as current liabilities. |
| Debt-to-Equity Ratio | Total Debt / Total Equity | Measures financial leverage. A higher ratio indicates higher reliance on debt financing. | A debt-to-equity ratio of 0.5 means that a company has 0.5 times more debt than equity. |
| Quick Ratio | (Current Assets – Inventory) / Current Liabilities | A more conservative measure of short-term liquidity, excluding inventory. | A quick ratio of 1.5 suggests strong short-term liquidity, even without considering inventory. |
Illustrative Example
Let’s solidify our understanding with a simple example of a balance sheet for a fictional small business, “Sarah’s Bakery.” This example will illustrate how the different components interact and demonstrate the fundamental accounting equation in action.
The following balance sheet represents Sarah’s Bakery’s financial position as of December 31, 2023.
Sarah’s Bakery Balance Sheet – December 31, 2023
A balance sheet is presented in a standardized format, typically with assets listed first, followed by liabilities, and finally equity. The total of assets must always equal the total of liabilities and equity.
| Assets | Amount ($) | Liabilities | Amount ($) |
|---|---|---|---|
| Cash | 5,000 | Accounts Payable | 2,000 |
| Inventory (Flour, Sugar, etc.) | 3,000 | Loans Payable | 10,000 |
| Equipment (Oven, Mixer) | 12,000 | ||
| Total Assets | 20,000 | Total Liabilities | 12,000 |
| Equity | |||
| Owner’s Equity (Sarah’s Investment) | 8,000 | ||
| Total Liabilities and Equity | 20,000 |
Description of Line Items:
- Assets: These are what Sarah’s Bakery owns. Cash represents readily available funds. Inventory includes the raw materials needed for baking. Equipment represents the tools used in the baking process.
- Liabilities: These are what Sarah’s Bakery owes to others. Accounts Payable represents money owed to suppliers. Loans Payable represents money borrowed from a lender.
- Equity: This represents the owner’s stake in the business. Owner’s Equity shows Sarah’s initial investment in the bakery.
Visual Representation of the Balance Sheet
The balance sheet can be visualized using a simple diagram. Imagine a set of scales. On one side, you have the total assets (in this case, $20,000). On the other side, you have the combined total of liabilities and equity ($12,000 + $8,000 = $20,000). The scales are balanced because the fundamental accounting equation is satisfied: Assets = Liabilities + Equity. This demonstrates that the total value of what the business owns (assets) is equal to the combined value of what it owes to others (liabilities) and what the owner has invested (equity).
Investigate the pros of accepting Double Entry Accounting Explained with Examples in your business strategies.
Balance Sheet Limitations
While the balance sheet provides a valuable snapshot of a company’s financial position, it’s crucial to understand its limitations. Over-reliance on balance sheet data alone can lead to inaccurate conclusions about a company’s overall health and future prospects. Several factors contribute to these limitations.
The balance sheet, while offering a static view of a company’s financial position at a specific point in time, does not fully capture the dynamic nature of business operations. It presents a historical record rather than a prediction of future performance. This inherent limitation necessitates the use of other financial statements, like the income statement and cash flow statement, for a more comprehensive understanding.
Impact of Historical Cost Accounting
A significant limitation stems from the prevalent use of historical cost accounting. This method values assets at their original purchase price, regardless of subsequent changes in market value. For example, a piece of land purchased for $100,000 ten years ago might be worth significantly more today, but the balance sheet still reflects the $100,000 original cost. This can lead to an understatement of a company’s true net worth, especially during periods of inflation or significant asset appreciation. Conversely, assets that have depreciated in value will be shown at a higher value than their current market value, potentially misrepresenting the company’s current financial health. This discrepancy between book value and market value can be particularly pronounced for long-term assets.
Issues with Interpreting Balance Sheet Data in Isolation
Analyzing a balance sheet in isolation, without considering the income statement and cash flow statement, can lead to misleading interpretations. For instance, a company might show high levels of assets, but a low level of profitability (as revealed by the income statement). Similarly, a company may have substantial assets but insufficient cash flow (as shown in the cash flow statement) to meet its short-term obligations. The balance sheet provides a static picture; the income statement shows profitability over time, and the cash flow statement illustrates the actual cash inflows and outflows. Combining these three statements provides a more holistic and accurate assessment of a company’s financial position and performance. Without this broader perspective, the balance sheet alone offers an incomplete and potentially inaccurate view.
Ending Remarks
In conclusion, the balance sheet serves as a fundamental tool for assessing a company’s financial standing. While it provides a static picture at a specific moment, understanding its components—assets, liabilities, and equity—and their interrelationships is crucial for evaluating a business’s financial health. By carefully analyzing the balance sheet, alongside other financial statements, stakeholders can gain valuable insights into a company’s strengths, weaknesses, and overall financial stability. Remember that while the balance sheet offers a wealth of information, it’s always best to consider it within the context of the entire financial picture.
User Queries
What is the difference between a balance sheet and an income statement?
A balance sheet shows a company’s financial position at a specific point in time (assets, liabilities, equity), while an income statement shows its financial performance over a period (revenues, expenses, profits).
How often are balance sheets prepared?
Balance sheets are typically prepared at the end of each accounting period, which can be monthly, quarterly, or annually, depending on the company’s needs and reporting requirements.
Can a balance sheet predict future performance?
No, a balance sheet is a snapshot of the past. While it provides insights into a company’s current financial health, it doesn’t directly predict future performance. Other factors and analyses are needed for that.
What are some limitations of using only a balance sheet for analysis?
A balance sheet alone doesn’t provide a complete picture. It should be analyzed alongside other financial statements like the income statement and cash flow statement for a comprehensive understanding.