


Understanding Financial Statements: A Comprehensive Guide delves into the critical world of financial reporting, empowering readers to decipher the language of business. This guide unravels the complexities of income statements, balance sheets, and cash flow statements, providing a practical framework for interpreting financial health and making informed decisions. We explore key ratios, analyze statement relationships, and discuss the limitations and potential pitfalls of relying solely on quantitative data. By the end, you’ll be equipped to confidently assess a company’s financial performance and navigate the intricacies of financial analysis.
From understanding the fundamental accounting equation to calculating key financial ratios, this guide offers a step-by-step approach to mastering financial statement analysis. Real-world examples and hypothetical case studies illustrate core concepts, making the learning process engaging and accessible. Whether you’re a student, entrepreneur, investor, or simply curious about the financial world, this comprehensive guide provides the knowledge and tools to confidently interpret and utilize financial statements.
Introduction to Financial Statements
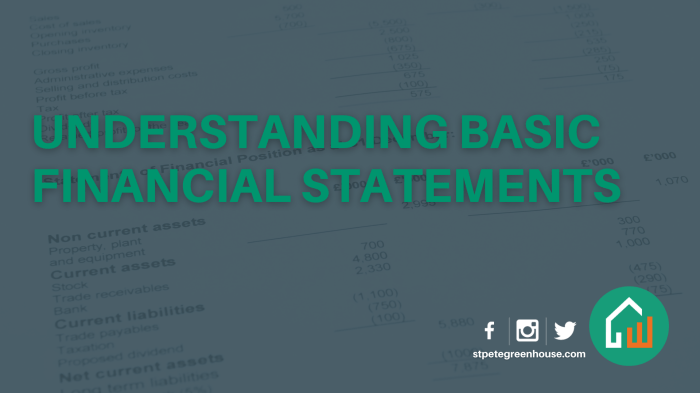
Financial statements are the cornerstone of understanding a business’s financial health. They provide a structured summary of a company’s financial performance, position, and cash flows, offering crucial insights to a wide range of stakeholders. These stakeholders, from investors and creditors to management and government agencies, rely on accurate and reliable financial statements to make informed decisions. Understanding how to interpret these statements is essential for anyone involved in the world of finance.
Financial statements serve as a vital communication tool, conveying complex financial information in a clear and concise manner. They allow for the assessment of profitability, liquidity, solvency, and overall financial stability. This information is critical for evaluating investment opportunities, extending credit, assessing risk, and making strategic business decisions.
The Three Main Financial Statements
The three primary financial statements—the Income Statement, the Balance Sheet, and the Cash Flow Statement—provide a comprehensive view of a company’s financial activities. Each statement offers a unique perspective, and together they paint a holistic picture. Analyzing these statements in conjunction allows for a more thorough and nuanced understanding of a business’s financial standing than any single statement could provide on its own.
Income Statement
The Income Statement, also known as the Profit and Loss (P&L) statement, summarizes a company’s revenues and expenses over a specific period, typically a quarter or a year. It shows the company’s net income or net loss—the difference between revenues and expenses. A simple Income Statement might include sections for revenue, cost of goods sold (COGS), gross profit, operating expenses, and finally, net income. For example, a retail company might show revenue from sales, subtract the cost of the goods sold to generate a gross profit, then deduct operating expenses like rent, salaries, and marketing to arrive at its net income. A higher net income generally indicates stronger financial performance.
Balance Sheet
The Balance Sheet presents a snapshot of a company’s assets, liabilities, and equity at a specific point in time. It adheres to the fundamental accounting equation:
Assets = Liabilities + Equity
Assets represent what a company owns (e.g., cash, accounts receivable, inventory, property, plant, and equipment). Liabilities represent what a company owes (e.g., accounts payable, loans, salaries payable). Equity represents the owners’ stake in the company (the difference between assets and liabilities). A balance sheet for a small bakery might show cash on hand as an asset, outstanding loans as a liability, and the owner’s investment as equity. Analyzing the balance sheet helps assess a company’s financial position and its ability to meet its obligations.
Cash Flow Statement
The Cash Flow Statement tracks the movement of cash both into and out of a company over a specific period. It categorizes cash flows into three main activities: operating activities (cash from core business operations), investing activities (cash from investments and capital expenditures), and financing activities (cash from debt, equity, and dividends). For instance, a technology startup might show positive cash flow from operating activities due to subscription revenue, negative cash flow from investing activities due to significant investments in research and development, and positive cash flow from financing activities due to a new round of venture capital funding. This statement is crucial for understanding a company’s liquidity and its ability to generate cash.
Internal Use of Financial Statements
Businesses utilize financial statements extensively for internal decision-making. They are used for performance evaluation, budgeting and forecasting, identifying areas for improvement, and guiding strategic planning. For example, a company might analyze its income statement to identify underperforming product lines or departments, then use this information to adjust pricing, cut costs, or reallocate resources. Similarly, the cash flow statement can help in making capital investment decisions, while the balance sheet aids in assessing the company’s overall financial health and creditworthiness. Regular review and analysis of these statements are critical for effective management and sustainable growth.
The Income Statement
The income statement, also known as the profit and loss (P&L) statement, is a crucial financial statement that summarizes a company’s financial performance over a specific period, typically a quarter or a year. It shows the revenues generated, the expenses incurred, and the resulting net income or net loss. Understanding the income statement is essential for evaluating a company’s profitability and overall financial health.
The income statement presents a clear picture of a company’s revenue generation and expense management. By analyzing this statement, stakeholders can assess the company’s efficiency, pricing strategies, and overall financial performance compared to previous periods or industry benchmarks. This information is invaluable for making informed investment and business decisions.
Components of the Income Statement
The primary components of an income statement are revenues, cost of goods sold (COGS), operating expenses, and net income (or net loss). Revenues represent the total income generated from the sale of goods or services. COGS includes the direct costs associated with producing those goods or services. Operating expenses encompass all other expenses incurred in running the business. The difference between revenues, COGS, and operating expenses determines the net income or net loss.
Example Income Statement for a Hypothetical Small Business
Let’s consider “Cozy Coffee Shop,” a hypothetical small business. Below is a sample income statement for the year ended December 31, 2023:
| Cozy Coffee Shop | Income Statement | For the Year Ended December 31, 2023 |
|---|---|---|
| Revenue | $150,000 | |
| Cost of Goods Sold (COGS) | $45,000 | |
| Gross Profit | $105,000 | |
| Operating Expenses: | ||
| Rent | $20,000 | |
| Salaries | $30,000 | |
| Utilities | $5,000 | |
| Marketing | $10,000 | |
| Total Operating Expenses | $65,000 | |
| Net Income | $40,000 |
Income Statement Formats: Single-Step vs. Multi-Step
There are two primary formats for presenting an income statement: single-step and multi-step. The single-step format simply subtracts total expenses from total revenues to arrive at net income. The multi-step format, however, breaks down the calculation of net income into several intermediate steps, providing a more detailed view of profitability.
The single-step format is simpler and easier to understand, while the multi-step format offers more granular information about different aspects of profitability, such as gross profit and operating income. The choice of format depends on the specific needs of the user and the level of detail required. For example, a small business might use a single-step format, while a large corporation might prefer a multi-step format to provide more comprehensive information to investors and analysts.
The Balance Sheet
The balance sheet provides a snapshot of a company’s financial position at a specific point in time. Unlike the income statement, which covers a period, the balance sheet shows what a company owns (assets), what it owes (liabilities), and the difference between the two (equity) on a particular date. Understanding the balance sheet is crucial for assessing a company’s financial health, liquidity, and solvency.
The balance sheet is based on the fundamental accounting equation, which represents the core relationship between a company’s assets, liabilities, and equity.
The Fundamental Accounting Equation
The fundamental accounting equation is:
Assets = Liabilities + Equity
This equation always holds true. Assets represent everything a company owns that has monetary value, liabilities represent what a company owes to others, and equity represents the owners’ stake in the company. The equation demonstrates that a company’s assets are financed either by borrowing (liabilities) or by investments from owners (equity).
Key Categories of Assets
Assets are categorized into current assets and non-current assets. Current assets are expected to be converted into cash or used up within one year, while non-current assets have a lifespan exceeding one year.
- Current Assets: Examples include cash, accounts receivable (money owed to the company by customers), inventory (goods available for sale), and prepaid expenses (expenses paid in advance).
- Non-Current Assets: Examples include property, plant, and equipment (PP&E), long-term investments, and intangible assets (patents, copyrights).
Key Categories of Liabilities
Similar to assets, liabilities are also categorized into current and non-current liabilities. Current liabilities are obligations due within one year, while non-current liabilities are due beyond one year.
- Current Liabilities: Examples include accounts payable (money owed to suppliers), salaries payable, short-term loans, and taxes payable.
- Non-Current Liabilities: Examples include long-term loans, bonds payable, and deferred tax liabilities.
Key Categories of Equity
Equity represents the residual interest in the assets of an entity after deducting all its liabilities. For a corporation, this is often referred to as shareholders’ equity.
- Share Capital: The amount invested by shareholders in exchange for shares of stock.
- Retained Earnings: Accumulated profits that have not been distributed as dividends.
Sample Balance Sheet, Understanding Financial Statements: A Comprehensive Guide
The following is a simplified example of a balance sheet:
| Assets | Liabilities and Equity | ||
|---|---|---|---|
| Current Assets | Current Liabilities | ||
| Cash | $10,000 | Accounts Payable | $5,000 |
| Accounts Receivable | $5,000 | Salaries Payable | $2,000 |
| Inventory | $15,000 | Short-term Loan | $3,000 |
| Total Current Assets | $30,000 | Total Current Liabilities | $10,000 |
| Non-Current Assets | Non-Current Liabilities | ||
| Property, Plant & Equipment | $50,000 | Long-term Loan | $20,000 |
| Total Non-Current Assets | $50,000 | Total Non-Current Liabilities | $20,000 |
| Total Assets | $80,000 | Total Liabilities | $30,000 |
| Equity | |||
| Share Capital | $20,000 | ||
| Retained Earnings | $30,000 | ||
| Total Equity | $50,000 | ||
| Total Liabilities and Equity | $80,000 |
The Statement of Cash Flows
The Statement of Cash Flows provides a detailed picture of a company’s cash inflows and outflows over a specific period. Unlike the income statement, which uses accrual accounting, the statement of cash flows focuses solely on actual cash movements. This is crucial for understanding a company’s liquidity, its ability to meet short-term obligations, and its overall financial health. Analyzing this statement alongside the income statement and balance sheet offers a comprehensive view of a company’s financial performance.
Operating Activities
This section reflects cash flows generated from the company’s core business operations. It includes cash received from customers, payments to suppliers, salaries, taxes, and interest payments. Understanding operating cash flow is vital as it indicates the company’s ability to generate cash from its day-to-day activities. Positive operating cash flow generally suggests a healthy and sustainable business model.
Examples of Cash Inflows: Cash received from customers for goods sold, cash received from service revenue, interest received.
Examples of Cash Outflows: Payments to suppliers for inventory, salaries and wages paid, rent payments, utility payments, interest paid on loans, income taxes paid.
Investing Activities
This section details cash flows related to investments in long-term assets and other investments. This includes purchases and sales of property, plant, and equipment (PP&E), investments in other companies, and proceeds from the sale of assets. Analyzing investing activities helps assess a company’s capital allocation strategy and its growth prospects.
Examples of Cash Inflows: Proceeds from the sale of equipment, proceeds from the sale of investments.
Examples of Cash Outflows: Purchase of equipment, purchase of land, investments in other companies.
Do not overlook the opportunity to discover more about the subject of Amazon FBA Accounting Everything You Need to Know.
Financing Activities
This section shows cash flows related to a company’s financing, including debt, equity, and dividends. It covers activities like issuing debt (loans or bonds), issuing equity (stock), repurchasing stock, and paying dividends. This section reveals how a company finances its operations and manages its capital structure.
Examples of Cash Inflows: Proceeds from issuing stock, proceeds from issuing bonds, proceeds from bank loans.
Examples of Cash Outflows: Repurchase of company stock, repayment of debt, payment of dividends.
Hypothetical Statement of Cash Flows for “Acme Corp.”
The following table presents a simplified hypothetical statement of cash flows for Acme Corp. for the year ended December 31, 2023. Note that this is a simplified example and real-world statements are often far more detailed.
| Category | Cash Inflows | Cash Outflows | Net Cash Flow |
|---|---|---|---|
| Operating Activities | $500,000 | $300,000 | $200,000 |
| Investing Activities | $50,000 | $150,000 | -$100,000 |
| Financing Activities | $100,000 | $20,000 | $80,000 |
| Net Increase/Decrease in Cash | $180,000 |
Analyzing Financial Statement Relationships: Understanding Financial Statements: A Comprehensive Guide
Understanding the individual financial statements—the income statement, balance sheet, and statement of cash flows—is crucial. However, the true power of financial statement analysis lies in examining the relationships between these statements. By calculating and interpreting key financial ratios, we gain a much deeper understanding of a company’s financial health, performance, and risk profile. This analysis allows for a more comprehensive assessment than simply reviewing individual statement figures in isolation.
Profitability Ratios
Profitability ratios measure a company’s ability to generate earnings from its operations. These ratios provide insights into how efficiently a company manages its resources to produce profits. Several key profitability ratios offer different perspectives on a company’s earnings power.
- Gross Profit Margin: This ratio shows the percentage of revenue remaining after deducting the cost of goods sold. It’s calculated as:
Gross Profit Margin = (Revenue – Cost of Goods Sold) / Revenue
A higher gross profit margin indicates greater efficiency in production or pricing.
- Net Profit Margin: This ratio indicates the percentage of revenue remaining after all expenses, including taxes and interest, are deducted. It’s calculated as:
Net Profit Margin = Net Income / Revenue
A higher net profit margin reflects better overall profitability and cost control.
- Return on Assets (ROA): ROA measures how efficiently a company uses its assets to generate profit. It’s calculated as:
ROA = Net Income / Total Assets
A higher ROA suggests better asset utilization and profitability.
- Return on Equity (ROE): ROE shows how effectively a company uses shareholder investments to generate profit. It’s calculated as:
ROE = Net Income / Shareholder Equity
A higher ROE indicates better returns for investors.
Liquidity Ratios
Liquidity ratios assess a company’s ability to meet its short-term obligations. These ratios are critical for determining a company’s ability to pay its bills as they come due.
- Current Ratio: This ratio compares current assets (assets that can be converted to cash within one year) to current liabilities (obligations due within one year). It’s calculated as:
Current Ratio = Current Assets / Current Liabilities
A current ratio above 1 generally indicates sufficient liquidity.
- Quick Ratio (Acid-Test Ratio): This is a more stringent measure of liquidity, excluding inventory from current assets. It’s calculated as:
Quick Ratio = (Current Assets – Inventory) / Current Liabilities
The quick ratio provides a more conservative view of a company’s short-term debt-paying ability.
Solvency Ratios
Solvency ratios gauge a company’s ability to meet its long-term obligations and its overall financial stability. These ratios help assess the risk of bankruptcy or financial distress.
- Debt-to-Equity Ratio: This ratio compares a company’s total debt to its shareholder equity. It’s calculated as:
Debt-to-Equity Ratio = Total Debt / Shareholder Equity
A higher debt-to-equity ratio suggests higher financial risk.
- Times Interest Earned Ratio: This ratio measures a company’s ability to cover its interest expense with its earnings. It’s calculated as:
Times Interest Earned = Earnings Before Interest and Taxes (EBIT) / Interest Expense
A higher ratio indicates greater ability to meet interest payments.
Comparative Financial Health Analysis
Let’s compare two hypothetical companies, Company A and Company B, using some key ratios. This comparison illustrates how ratio analysis can highlight differences in financial health.
Assume the following data (all figures in thousands):
| Ratio | Company A | Company B |
|————————–|————|————|
| Current Ratio | 2.5 | 1.2 |
| Quick Ratio | 1.8 | 0.7 |
| Debt-to-Equity Ratio | 0.8 | 2.0 |
| Net Profit Margin | 15% | 8% |
| Return on Assets (ROA) | 10% | 5% |
- Liquidity: Company A demonstrates significantly stronger liquidity than Company B, as indicated by higher current and quick ratios. This suggests Company A is better positioned to meet its short-term obligations.
- Solvency: Company B exhibits a higher debt-to-equity ratio, indicating greater financial leverage and higher risk compared to Company A.
- Profitability: Company A displays superior profitability, with a higher net profit margin and ROA, suggesting more efficient operations and better asset utilization.
Interpreting Financial Statement Data
Interpreting financial statement data is crucial for making informed business decisions. It involves analyzing the information presented in the income statement, balance sheet, and statement of cash flows to understand a company’s financial health, performance, and future prospects. This process goes beyond simply reading the numbers; it requires a critical evaluation of trends, ratios, and comparisons to industry benchmarks.
Understanding the relationships between different financial statement items is key to accurate interpretation. For example, a high level of accounts receivable might indicate slow collections and potential credit risk, while a high inventory turnover ratio could signal strong sales and efficient inventory management. Conversely, a low inventory turnover might indicate obsolete inventory or weak demand. Effective interpretation requires a thorough understanding of the underlying business and its industry.
Practical Examples of Interpreting Financial Statement Information
Analyzing a company’s profitability requires examining its income statement. For instance, comparing a company’s gross profit margin (revenue less cost of goods sold, divided by revenue) over several years can reveal trends in pricing power and cost management. A declining gross profit margin might signal increasing competition or rising input costs. Similarly, analyzing net profit margin (net income divided by revenue) reveals the overall profitability after all expenses are considered. A consistent increase in net profit margin indicates effective cost control and efficient operations. Consider a hypothetical scenario where Company A shows a consistently increasing net profit margin while Company B’s margin is declining; this suggests Company A is performing better in terms of profitability.
Furthermore, examining the balance sheet provides insights into a company’s financial position. A high debt-to-equity ratio indicates a higher reliance on debt financing, potentially increasing financial risk. Conversely, a low debt-to-equity ratio suggests a more conservative financial strategy. Analyzing the current ratio (current assets divided by current liabilities) helps assess a company’s short-term liquidity. A current ratio below 1 indicates potential short-term solvency issues. For example, if a company has a current ratio of 0.8, it means it doesn’t have enough current assets to cover its immediate liabilities.
Common Challenges and Pitfalls in Interpreting Financial Statements
Several challenges can hinder accurate interpretation. One common pitfall is focusing solely on individual numbers without considering the broader context. For example, a single year’s increase in revenue might seem positive, but a declining trend over several years paints a different picture. Another challenge is the use of different accounting methods, which can make comparisons between companies difficult. Furthermore, manipulating financial statements through aggressive accounting practices can distort the true financial picture, requiring careful scrutiny. Finally, a lack of industry knowledge can lead to misinterpretations; what might seem alarming for one industry could be normal for another.
The Importance of Considering Industry Benchmarks
Comparing a company’s financial performance to industry benchmarks is crucial for a meaningful interpretation. Industry averages provide a context for evaluating a company’s financial health and performance relative to its peers. For example, a company with a higher-than-average profit margin in its industry indicates superior performance, while a lower-than-average return on assets might suggest areas needing improvement. Reliable industry benchmarks can be obtained from industry reports, financial databases, and government publications. Using these benchmarks helps identify areas of strength and weakness and allows for a more objective assessment of a company’s financial position.
Financial Statement Limitations
Financial statements, while powerful tools for understanding a company’s financial health, are not without their limitations. They provide a snapshot of a company’s financial position at a specific point in time and its performance over a specific period, but this inherently incomplete picture can be subject to various biases and inaccuracies. Understanding these limitations is crucial for interpreting financial statements effectively and making informed decisions.
While financial statements aim for objectivity, several factors introduce subjectivity and potential for misrepresentation. These limitations stem from the inherent nature of accounting practices, the complexity of business operations, and the potential for deliberate manipulation. A comprehensive understanding of these limitations is essential for a truly informed analysis.
Accounting Estimates and Judgments
The preparation of financial statements often involves significant judgment and estimation. For instance, the useful life of an asset, the allowance for doubtful accounts, and the valuation of inventory all rely on estimations that can vary significantly depending on the assumptions made by management. These estimations, while based on best available information, introduce a degree of uncertainty into the reported figures. A company might, for example, overestimate the useful life of an asset to artificially inflate its net income in the short term, while conversely underestimating it to reduce tax liabilities in a later period. Such estimations can lead to discrepancies between reported financial figures and the underlying economic reality.
Potential for Manipulation
The inherent flexibility in accounting standards can be exploited for manipulative purposes. While accounting rules provide a framework, there’s often room for interpretation, allowing companies to present their financial position in a more favorable light than might be warranted by the underlying economic reality. Techniques like aggressive revenue recognition, creative accounting treatments of expenses, or the manipulation of inventory valuation can all distort the true financial picture. The Enron scandal serves as a stark reminder of the potential consequences of such manipulative practices. In this case, Enron used special purpose entities to hide debt and inflate earnings, ultimately leading to the company’s collapse.
Qualitative Factors
Financial statements primarily focus on quantitative data, neglecting crucial qualitative factors that significantly impact a company’s long-term prospects. These qualitative factors include management quality, employee morale, brand reputation, customer loyalty, and competitive landscape. For example, a company might report strong financial performance, but if its management is plagued by internal conflicts or its brand reputation is tarnished, its future performance could be significantly jeopardized. Ignoring these qualitative aspects can lead to an incomplete and potentially misleading assessment of the company’s overall health.
The Role of Auditing
Independent audits play a crucial role in enhancing the reliability of financial statements. Auditors, independent accounting professionals, examine a company’s financial records and accounting practices to ensure compliance with generally accepted accounting principles (GAAP) and to provide reasonable assurance that the financial statements are free from material misstatement. While audits do not guarantee the absolute accuracy of financial statements, they provide a level of assurance to investors and other stakeholders that the information presented is credible. However, even with auditing, the limitations mentioned above still persist, highlighting the need for a critical and comprehensive analysis of the information presented.
Visualizing Financial Data
Effective visualization is crucial for understanding complex financial information. Charts and graphs transform raw data into easily digestible insights, revealing trends, patterns, and relationships that might otherwise remain hidden. This section explores how visualizing financial data can enhance our understanding of a company’s performance and financial health.
Net Income Trend Over Five Years
This line chart illustrates the net income of a hypothetical company, “Acme Corp,” over a five-year period (2019-2023). The horizontal axis represents the year, while the vertical axis displays net income in millions of dollars. The line itself connects data points representing Acme Corp.’s net income for each year. For example, in 2019, Acme Corp. reported a net income of $2 million. This increased steadily to $4 million in 2020 and $6 million in 2021. However, in 2022, net income dipped slightly to $5.5 million, possibly due to unforeseen market fluctuations or increased operational costs. In 2023, Acme Corp. experienced a strong recovery, reaching a net income of $7 million. The overall trend shows a generally upward trajectory, indicating positive growth despite temporary setbacks. The visual representation of this data allows for a quick and intuitive grasp of Acme Corp.’s financial performance over time.
Debt-to-Equity Ratio Comparison
This bar chart compares the debt-to-equity ratios of two companies, “Beta Industries” and “Gamma Corp,” for the year 2023. The horizontal axis identifies each company, while the vertical axis represents the debt-to-equity ratio. Each company is represented by a bar whose height corresponds to its debt-to-equity ratio. For instance, if Beta Industries has a debt-to-equity ratio of 0.8, its bar will extend to the 0.8 mark on the vertical axis. If Gamma Corp. has a debt-to-equity ratio of 1.5, its bar will be taller, reflecting a higher level of debt relative to equity. A visual comparison of the bars immediately highlights which company has a higher reliance on debt financing. This chart allows for a clear and concise comparison of the financial leverage of the two companies, facilitating a rapid assessment of their relative risk profiles.
Final Summary
Mastering the art of interpreting financial statements is crucial for success in today’s business landscape. This guide has provided a comprehensive overview of the key financial statements, their components, and how they relate to one another. By understanding these concepts and applying the analytical techniques discussed, you can gain valuable insights into a company’s financial health, make informed decisions, and ultimately, achieve your financial goals. Remember to always consider the limitations of financial statements and incorporate qualitative factors for a holistic understanding. This comprehensive approach to financial statement analysis will serve as a robust foundation for future financial endeavors.
Key Questions Answered
What is the difference between accrual and cash accounting?
Accrual accounting recognizes revenue when earned and expenses when incurred, regardless of when cash changes hands. Cash accounting recognizes revenue and expenses only when cash is received or paid.
How can I identify potential accounting fraud in financial statements?
Look for inconsistencies, unusual entries, lack of supporting documentation, and discrepancies between reported figures and operational realities. Independent audits can help uncover such issues.
What are some common mistakes people make when interpreting financial statements?
Common mistakes include focusing solely on one ratio, ignoring industry benchmarks, failing to consider qualitative factors, and misinterpreting the impact of accounting methods.
Where can I find financial statements for publicly traded companies?
Publicly traded companies are required to file their financial statements with regulatory bodies like the SEC (in the US). These statements are typically available on the company’s investor relations website.