


The Importance of Regular Financial Statement Analysis underscores the critical role financial statements play in a company’s success. Understanding these documents—the balance sheet, income statement, and cash flow statement—provides a clear picture of a company’s financial health, allowing for informed decision-making. This analysis isn’t just for accountants; it’s a crucial tool for investors, business owners, and anyone seeking to understand a company’s performance and potential.
By analyzing key ratios and trends over time, stakeholders can identify areas of strength and weakness, predict future performance, and make strategic adjustments. This process involves comparing a company’s performance against industry benchmarks and competitors, providing a comprehensive assessment of its position within the market. Ultimately, mastering financial statement analysis empowers informed decisions, driving profitability, and mitigating risk.
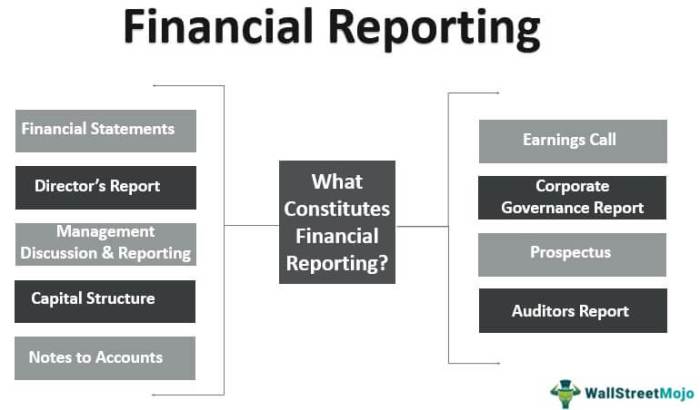
Understanding Financial Statements
Regular analysis of financial statements is crucial for making informed business decisions. Understanding the purpose and components of each statement—the balance sheet, income statement, and cash flow statement—is the foundation of effective financial analysis. These three core statements provide a comprehensive picture of a company’s financial health, allowing stakeholders to assess its profitability, liquidity, and solvency.
The Balance Sheet: A Snapshot of Assets, Liabilities, and Equity, The Importance of Regular Financial Statement Analysis
The balance sheet presents a snapshot of a company’s financial position at a specific point in time. It follows the fundamental accounting equation: Assets = Liabilities + Equity. Assets represent what a company owns (e.g., cash, accounts receivable, inventory, property, plant, and equipment), liabilities represent what a company owes (e.g., accounts payable, loans payable, salaries payable), and equity represents the owners’ stake in the company (e.g., common stock, retained earnings). Analyzing the balance sheet helps assess a company’s liquidity (ability to meet short-term obligations) and solvency (ability to meet long-term obligations). For example, a high ratio of current assets to current liabilities indicates strong short-term liquidity.
The Income Statement: Measuring Profitability Over Time
The income statement, also known as the profit and loss (P&L) statement, reports a company’s financial performance over a specific period (e.g., a quarter or a year). It shows the revenues generated, the expenses incurred, and the resulting net income or net loss. Key components include revenue (sales), cost of goods sold (COGS), gross profit (revenue – COGS), operating expenses (selling, general, and administrative expenses), operating income, interest expense, income tax expense, and net income. Analyzing the income statement helps assess a company’s profitability and efficiency in managing its operations. For instance, a consistently increasing net income suggests strong profitability.
The Cash Flow Statement: Tracking Cash Inflows and Outflows
The cash flow statement tracks the movement of cash both into and out of a company over a specific period. It categorizes cash flows into three main activities: operating activities (cash flows from the company’s main business operations), investing activities (cash flows related to the purchase and sale of long-term assets), and financing activities (cash flows related to debt, equity, and dividends). Analyzing the cash flow statement helps assess a company’s liquidity and its ability to generate cash from its operations. For example, a strong positive cash flow from operations indicates a healthy and sustainable business model.
Comparison of Financial Statements
| Statement Type | Key Metrics | Time Period | Purpose |
|---|---|---|---|
| Balance Sheet | Assets, Liabilities, Equity, Current Ratio, Debt-to-Equity Ratio | Specific Point in Time | Shows financial position at a specific moment |
| Income Statement | Revenue, Expenses, Net Income, Gross Profit Margin, Net Profit Margin | Period (e.g., quarter, year) | Shows financial performance over a period |
| Cash Flow Statement | Cash from Operations, Cash from Investing, Cash from Financing, Free Cash Flow | Period (e.g., quarter, year) | Shows cash inflows and outflows over a period |
Ratio Analysis: The Importance Of Regular Financial Statement Analysis
Ratio analysis is a crucial tool for understanding a company’s financial health and performance. By examining the relationships between different line items in the financial statements, we can gain valuable insights into profitability, liquidity, solvency, and operational efficiency. This allows for a more comprehensive assessment than simply looking at individual figures. These insights are invaluable for investors, creditors, and management alike in making informed decisions.
Key Financial Ratios and Their Interpretation
Understanding several key financial ratios is essential for effective financial statement analysis. These ratios provide a standardized way to compare a company’s performance over time and against its competitors. The ratios should be analyzed in context, considering the industry and the company’s specific circumstances.
- Profitability: Gross Profit Margin: This ratio measures the profitability of a company’s core operations. It’s calculated as (Revenue – Cost of Goods Sold) / Revenue. A higher gross profit margin indicates greater efficiency in managing production costs. For example, a gross profit margin of 40% suggests that for every dollar of revenue, 40 cents are left to cover operating expenses and generate profit.
- Profitability: Return on Equity (ROE): ROE indicates how effectively a company is using shareholder investments to generate profits. It’s calculated as Net Income / Shareholder Equity. A higher ROE generally suggests better management of assets and higher profitability for investors. A company with an ROE of 15% is generating $0.15 in profit for every dollar of shareholder equity.
- Liquidity: Current Ratio: This ratio assesses a company’s ability to meet its short-term obligations. It’s calculated as Current Assets / Current Liabilities. A current ratio of 2.0 suggests that a company has twice the amount of current assets to cover its current liabilities. A higher ratio generally indicates better liquidity, although excessively high ratios might suggest inefficient use of assets.
- Solvency: Debt-to-Equity Ratio: This ratio measures the proportion of a company’s financing that comes from debt compared to equity. It’s calculated as Total Debt / Shareholder Equity. A higher debt-to-equity ratio indicates higher financial risk, as the company relies more heavily on debt financing. A ratio of 1.0 means that the company has equal amounts of debt and equity financing.
- Efficiency: Inventory Turnover: This ratio measures how efficiently a company manages its inventory. It’s calculated as Cost of Goods Sold / Average Inventory. A higher inventory turnover ratio suggests that the company is selling its inventory quickly, minimizing storage costs and reducing the risk of obsolescence. A turnover ratio of 6 means that the company sells and replaces its inventory six times a year.
Illustrative Scenario: Ratio Analysis in Action
Imagine a retail company, “Trendy Threads,” experiencing a decline in its profitability ratios over the past two years. Their gross profit margin has fallen from 45% to 35%, and their ROE has dropped from 18% to 10%. Simultaneously, their current ratio has decreased from 1.8 to 1.2, indicating potential liquidity issues. Their debt-to-equity ratio has increased from 0.8 to 1.5, suggesting increased reliance on debt financing. Finally, their inventory turnover has decreased from 8 to 5, indicating slower inventory movement. These changes signal potential problems. Trendy Threads might be facing increased competition, higher input costs, or inefficient inventory management. This analysis would prompt a deeper investigation into the underlying causes of these trends, potentially leading to operational improvements and a more sustainable business model. Alternatively, a scenario where these ratios are improving would suggest positive business developments.
Trend Analysis

Analyzing financial statements over multiple periods, rather than just a single snapshot in time, offers a powerful way to understand a company’s performance and predict future outcomes. This longitudinal view reveals underlying trends and patterns that might be missed in a static analysis. By tracking key metrics over time, businesses can identify areas of strength and weakness, anticipate potential problems, and make more informed decisions.
Trend analysis involves systematically examining historical financial data to identify patterns and predict future performance. This process allows businesses to monitor their progress, identify emerging trends, and adapt their strategies accordingly. It provides a deeper understanding of the company’s financial health than a single-period analysis could ever achieve.
Identifying Trends in Key Financial Metrics
Identifying trends involves selecting key financial metrics relevant to the business’s goals and then tracking their values over several periods. For example, a company might track revenue growth, profit margins, debt levels, and inventory turnover. These metrics are then compared across different periods to observe changes and patterns. Significant increases or decreases in these metrics can signal important developments within the business. For instance, consistently declining profit margins could indicate a need to review pricing strategies or operational efficiency. Conversely, steadily increasing revenue could point to successful marketing campaigns or expanding market share. The specific metrics chosen will depend on the industry, the size of the company, and the specific questions being asked.
Visual Representation of Trends Using Line Graphs
A line graph is an effective way to visualize trends identified in financial statement analysis. The horizontal axis represents the time period (e.g., years, quarters), while the vertical axis represents the value of the chosen financial metric. Each data point on the graph represents the metric’s value for a specific period. A line connects these data points, illustrating the trend over time. For example, a line graph showing revenue over five years would have years on the horizontal axis and revenue amounts on the vertical axis. Each year’s revenue would be represented by a point, and a line would connect these points, clearly illustrating the growth or decline in revenue over the five-year period. A sharp upward slope indicates strong growth, while a downward slope shows decline. A relatively flat line suggests stability. Multiple lines can be plotted on the same graph to compare different metrics simultaneously, allowing for a more comprehensive analysis. For instance, one could plot revenue and profit margin on the same graph to see how changes in revenue affect profit margins over time.
Steps Involved in Conducting a Trend Analysis
Conducting a thorough trend analysis involves a series of well-defined steps. The accuracy and insights gained are directly dependent on the rigor of this process.
- Define Objectives: Clearly state the goals of the analysis. What specific trends are you trying to identify? This step ensures the analysis remains focused and relevant.
- Select Key Metrics: Identify the financial metrics that are most important for understanding the business’s performance and achieving the objectives defined in the first step. This selection should be tailored to the specific context and industry.
- Gather Historical Data: Collect the necessary financial data from past periods. The number of periods included will depend on the desired level of detail and the stability of the business’s environment. More data generally leads to more reliable trend identification.
- Calculate and Analyze Trends: Calculate the percentage change or growth rate of each selected metric over time. Analyze the resulting data to identify patterns, significant changes, and potential outliers. This step requires careful observation and interpretation.
- Visualize the Trends: Create line graphs or other visual representations to illustrate the identified trends. Visualizations make it easier to identify patterns and communicate findings to others.
- Interpret Results and Draw Conclusions: Based on the visualized trends and calculated changes, interpret the results and draw meaningful conclusions. Consider external factors that might have influenced the observed trends.
Benchmarking
Benchmarking is a crucial aspect of financial statement analysis, allowing businesses to gauge their performance relative to competitors and industry standards. By comparing key financial ratios and metrics, companies can identify areas of strength and weakness, ultimately informing strategic decision-making and driving improvements in profitability and efficiency. This comparative analysis provides a valuable context for interpreting a company’s own financial health.
Comparative Analysis of Two Hypothetical Companies
Let’s consider two hypothetical companies, “Alpha Corp” and “Beta Inc.”, both operating in the retail clothing industry. We will analyze their performance using key financial ratios derived from their financial statements. The following analysis highlights the importance of benchmarking for identifying areas for improvement. We’ll assume both companies operate at a similar scale to allow for a meaningful comparison.
Key Financial Ratios Comparison
A comparative analysis of Alpha Corp and Beta Inc. using key financial ratios reveals significant differences in their financial performance. The following table presents a comparative analysis:
| Ratio | Alpha Corp | Beta Inc. | Industry Average |
|---|---|---|---|
| Gross Profit Margin | 35% | 40% | 38% |
| Net Profit Margin | 10% | 15% | 12% |
| Return on Assets (ROA) | 8% | 12% | 10% |
| Current Ratio | 1.8 | 2.2 | 2.0 |
Strengths and Weaknesses
Based on the ratio analysis, Beta Inc. demonstrates superior profitability compared to Alpha Corp and the industry average, as evidenced by higher gross profit margin, net profit margin, and return on assets. This suggests Beta Inc. is more efficient in managing costs and generating profits. Alpha Corp, while having a current ratio slightly below the industry average, indicating adequate short-term liquidity, lags behind Beta Inc. in profitability metrics. This suggests Alpha Corp may need to focus on improving its pricing strategies, cost controls, or inventory management to enhance profitability.
Utilizing Industry Averages and Competitor Data
Industry averages provide a valuable benchmark against which to compare a company’s performance. Deviations from the average can highlight areas requiring attention. For instance, Alpha Corp’s lower-than-average net profit margin suggests areas for improvement in cost management or pricing strategies. Further, analyzing competitor data, like Beta Inc.’s superior performance, can provide insights into best practices and potential strategies for improvement. By studying competitors’ successful strategies, Alpha Corp can identify opportunities to enhance its own operational efficiency and profitability. Regular monitoring of industry trends and competitor performance allows for proactive adjustments to maintain a competitive advantage.
The Role of Regular Financial Statement Analysis in Decision Making
Regular financial statement analysis is not merely a compliance exercise; it’s a crucial tool for informed decision-making across all aspects of a business. By systematically examining a company’s financial health, businesses can make strategic choices, optimize operations, and mitigate risks, ultimately leading to enhanced profitability and sustainable growth. This analysis provides a clear picture of the company’s performance, allowing for proactive adjustments and informed choices.
Strategic Planning
Regular analysis of financial statements provides the foundation for effective strategic planning. By identifying trends in revenue, expenses, and profitability, businesses can anticipate future challenges and opportunities. For instance, a consistent decline in sales might signal the need for a new marketing strategy or product diversification. Conversely, strong growth in a particular segment could justify increased investment in that area. Analysis of key financial ratios, such as return on assets (ROA) and return on equity (ROE), provides insights into the efficiency and profitability of the business, informing decisions about resource allocation and future investments. A company with a consistently high ROA might consider expanding its operations, while a company with a low ROA might need to restructure its operations to improve efficiency.
Investment Decisions
Financial statement analysis is paramount in making sound investment decisions. Investors use this analysis to assess the financial health and potential profitability of companies before investing in their stocks or bonds. Ratio analysis, for example, helps determine a company’s liquidity, solvency, and profitability. Analyzing trends in revenue growth, earnings per share (EPS), and dividend payouts provides crucial information for valuing a company’s stock. For example, a consistently increasing EPS over several years might suggest a strong growth trajectory and warrant a higher stock valuation. Conversely, declining EPS could signal financial trouble and warrant caution. Fundamental analysis, which relies heavily on financial statement analysis, helps investors make informed decisions about which companies to invest in and at what price.
Operational Improvements and Cost Reduction Strategies
Regular analysis of financial statements can pinpoint areas for operational improvement and cost reduction. By comparing expenses across different periods or against industry benchmarks, businesses can identify areas of inefficiency. For example, a significant increase in the cost of goods sold (COGS) might indicate a need to renegotiate supplier contracts or explore alternative sourcing options. Similarly, high administrative expenses might necessitate streamlining internal processes or reducing staff. Detailed analysis of income statements and balance sheets allows for the identification of cost drivers and the development of targeted cost-reduction strategies, ultimately enhancing profitability and competitiveness.
Credit Risk Assessment
Financial statement analysis plays a vital role in assessing credit risk. Lenders rely heavily on this analysis to determine the creditworthiness of borrowers. Analyzing ratios such as the debt-to-equity ratio, current ratio, and times interest earned helps assess a borrower’s ability to repay debt. A high debt-to-equity ratio might indicate a higher risk of default, while a strong current ratio suggests sufficient liquidity to meet short-term obligations. Lenders use this information to make informed decisions about loan applications, setting appropriate interest rates and credit limits. A thorough analysis reduces the lender’s exposure to potential losses from loan defaults.
Limitations and Challenges
:max_bytes(150000):strip_icc()/financialstatements-final-d1268249b5284b3989c979ee82f2869e.png?w=700)
Financial statement analysis, while a powerful tool, is not without its limitations. Over-reliance on solely quantitative data from financial statements can lead to incomplete or even misleading conclusions. A comprehensive understanding requires careful consideration of both the quantitative information presented and the qualitative factors influencing a company’s performance and prospects.
While financial statements offer a valuable snapshot of a company’s financial health, they are not a perfect reflection of reality. Several factors can impact the accuracy and completeness of the information, leading to challenges in interpretation and potentially flawed decision-making.
Limitations of Financial Statement Analysis Alone
Financial statements primarily present historical data. They offer a backward-looking perspective, which may not accurately predict future performance. For example, a company with consistently high profits in the past might experience a significant downturn due to unforeseen market changes or internal issues not reflected in previous statements. Furthermore, financial statements often present aggregated data, masking the details of individual business segments or projects. This aggregated view can obscure crucial information regarding the performance of specific aspects of the business. Finally, the analysis relies on the accuracy and consistency of the accounting practices employed, which may vary across companies and industries.
The Importance of Qualitative Factors
Qualitative factors significantly influence a company’s financial performance and overall health, yet are often overlooked in analyses solely based on quantitative data. These factors include management quality, employee morale, brand reputation, customer loyalty, and the competitive landscape. For instance, a company with strong financial figures might be facing increasing competition from innovative rivals, a fact not readily apparent in the financial statements. Similarly, a company with excellent financial performance might have a toxic work environment, impacting long-term sustainability. Incorporating qualitative assessments provides a more holistic and realistic picture of a company’s true financial standing and future potential.
Challenges of Different Accounting Standards
Interpreting financial statements from companies operating under different accounting standards presents significant challenges. Different standards allow for variations in accounting practices, making direct comparisons difficult. For example, a company using U.S. Generally Accepted Accounting Principles (GAAP) might report inventory differently than a company using International Financial Reporting Standards (IFRS). These differences can lead to inconsistencies in reported financial figures, making it difficult to benchmark performance accurately and draw meaningful conclusions. The process of reconciling financial statements prepared under different standards adds complexity and requires specialized knowledge.
Potential Biases and Inaccuracies in Financial Reporting
Several factors can introduce biases and inaccuracies into financial reporting, potentially affecting the reliability of any subsequent analysis.
- Earnings Management: Companies may manipulate accounting practices to present a more favorable financial picture than the reality.
- Aggressive Accounting: Using aggressive accounting methods to inflate profits or understate liabilities can lead to misrepresentation of the true financial position.
- Off-Balance Sheet Financing: Hiding liabilities or debt through off-balance sheet financing techniques distorts the financial statements.
- Window Dressing: Manipulating the timing of transactions near the end of a reporting period to improve the appearance of financial results.
- Subjectivity in Estimates: Many accounting figures rely on estimations (e.g., bad debt expense, useful life of assets), which can be influenced by managerial bias.
Outcome Summary
Regular financial statement analysis is not merely a routine exercise; it is a powerful tool for navigating the complexities of the business world. By understanding the interplay between different financial statements, interpreting key ratios, and identifying trends, businesses can proactively address challenges, capitalize on opportunities, and make informed decisions that drive long-term success. The insights gleaned from this process are invaluable for strategic planning, investment decisions, operational improvements, and risk management, ultimately contributing to a healthier and more resilient organization.
FAQ Resource
What are some common mistakes made in financial statement analysis?
Common mistakes include failing to consider qualitative factors, relying solely on historical data without forecasting, misinterpreting ratios without context, and neglecting industry benchmarks.
How often should financial statements be analyzed?
The frequency depends on the business’s needs and industry. Monthly or quarterly analysis is common for smaller businesses, while larger corporations may analyze statements more frequently.
Can I use financial statement analysis for personal finance?
Yes, many of the principles apply to personal finance. Tracking income and expenses, monitoring debt levels, and analyzing net worth are all forms of personal financial statement analysis.
What software can help with financial statement analysis?
Various software options exist, from spreadsheet programs like Excel to dedicated financial analysis software. The choice depends on the complexity of the analysis and the user’s technical skills.
When investigating detailed guidance, check out How to Effectively Manage Accounts Payable and Receivable now.


:max_bytes(150000):strip_icc()/accounting-valuation.asp_Final-f441df548f6444ca9db23e01b7ea9efe.png?w=700)