


The Benefits of Integrating Accounting and Business Intelligence unlock a transformative potential for businesses of all sizes. By seamlessly merging financial data with operational insights, organizations gain a comprehensive view of their performance, fostering more informed decision-making and driving significant improvements across various aspects of the business. This integration isn’t merely about consolidating data; it’s about harnessing the power of that data to optimize processes, mitigate risks, and ultimately, achieve greater success.
This powerful synergy allows for proactive, data-driven strategies rather than reactive responses to changing market conditions. Imagine having real-time visibility into key performance indicators (KPIs), enabling you to anticipate challenges and capitalize on opportunities with unprecedented speed and accuracy. This integration streamlines operations, enhances financial forecasting, improves customer relationships, and provides a robust foundation for strategic growth. We’ll explore each of these benefits in detail, illustrating how the combination of accounting precision and business intelligence’s analytical power creates a winning formula for modern business success.
Enhanced Decision-Making
Integrating accounting and business intelligence (BI) systems significantly enhances the speed and accuracy of business decision-making. By combining financial data with operational and market insights, businesses gain a holistic view of their performance, allowing for more informed and strategic choices. This integration moves decision-making from a largely reactive process, based on lagging indicators, to a proactive strategy driven by real-time data and predictive analytics.
The seamless flow of information between accounting and BI systems dramatically reduces the time spent gathering and analyzing data. Instead of relying on disparate spreadsheets and reports, decision-makers have access to a centralized, unified dashboard providing a comprehensive overview of key performance indicators (KPIs). This immediacy minimizes delays and allows for quicker responses to market changes or operational challenges.
Key Performance Indicators (KPIs) and Their Availability
Through integration, numerous KPIs become readily accessible, providing a detailed picture of organizational health. Examples include revenue growth, profit margins, customer acquisition cost, inventory turnover, and sales conversion rates. These metrics, once scattered across various systems, are now presented in a cohesive manner, revealing trends and patterns that might otherwise be missed. Furthermore, the ability to drill down into individual components of these KPIs allows for granular analysis, identifying specific areas needing attention or improvement. For instance, analyzing low sales conversion rates might reveal inefficiencies in the sales process or a need for improved marketing strategies. Similarly, high inventory turnover could indicate strong demand or potentially inefficient inventory management.
Real-time Data Access and Proactive Decision-Making
Real-time data access is a game-changer for proactive decision-making. Instead of reacting to problems after they’ve occurred, businesses can anticipate challenges and opportunities. Imagine a retailer receiving real-time sales data showing a sudden drop in sales of a particular product. With integrated systems, they can immediately investigate the cause – perhaps a competitor’s promotion or a negative online review – and take corrective action before the issue escalates. This proactive approach minimizes losses and maximizes opportunities. Likewise, real-time insights into inventory levels can prevent stockouts or overstocking, optimizing supply chain efficiency.
Comparison of Decision-Making Processes
| Aspect | Without Integrated Systems | With Integrated Systems |
|---|---|---|
| Data Access | Slow, fragmented, and often inaccurate; requires manual collation from multiple sources. | Fast, centralized, and accurate; real-time access to a unified data view. |
| Analysis Time | Lengthy and labor-intensive; involves significant manual effort. | Rapid and efficient; automated analysis tools provide quick insights. |
| Decision Speed | Slow and reactive; responses to issues are often delayed. | Fast and proactive; allows for timely interventions and opportunities. |
| Decision Accuracy | Prone to errors due to incomplete or inaccurate data. | Highly accurate; based on comprehensive and reliable data. |
Improved Financial Forecasting and Budgeting
Integrating accounting data with business intelligence (BI) tools revolutionizes financial forecasting and budgeting. By combining historical financial data with real-time operational insights, businesses gain a far more accurate and nuanced understanding of their financial future, enabling proactive adjustments and improved resource allocation. This leads to more robust financial plans and ultimately, stronger financial performance.
The seamless flow of data between accounting systems and BI platforms allows for more accurate financial forecasting. Instead of relying solely on past trends or subjective estimations, businesses can leverage advanced analytics to identify patterns, predict future performance, and model various scenarios with greater precision. This reduces the reliance on potentially inaccurate assumptions and provides a more realistic picture of future financial health.
More Accurate Financial Forecasting with Integrated Data
Utilizing integrated data enhances forecasting accuracy by providing a holistic view of the business. For instance, combining sales data from CRM systems with inventory levels from accounting software allows for more accurate sales projections. Similarly, integrating marketing campaign data with sales figures can reveal the ROI of specific campaigns, leading to more effective budget allocation in future marketing efforts. This integrated approach reduces forecasting errors stemming from incomplete or siloed data. For example, a company using only sales figures from the previous year might underestimate sales growth if a new marketing campaign is expected to significantly boost sales. By integrating data from the marketing campaign, the forecast becomes significantly more accurate.
Improving Budget Accuracy and Allocation with BI Tools
Business intelligence tools, when connected to accounting data, offer powerful capabilities for improving budget accuracy and allocation. These tools allow for detailed analysis of historical spending patterns, identification of cost drivers, and the creation of more realistic budget scenarios. They can also automate the budget allocation process, ensuring resources are distributed efficiently across different departments and projects based on performance and strategic priorities. For example, a BI dashboard could highlight departments consistently exceeding their budgets, allowing for immediate investigation and corrective action. Another dashboard could show the return on investment for different projects, helping to prioritize funding towards the most promising initiatives.
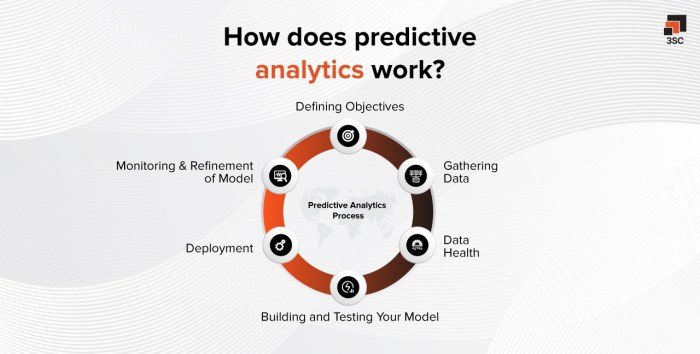
Predictive Analytics for Enhanced Budget Planning and Resource Allocation
Predictive analytics, a key feature of many BI tools, leverages historical data and advanced algorithms to forecast future financial performance with greater accuracy. This allows businesses to proactively adjust their budgets based on anticipated changes in market conditions, sales trends, or operational efficiency. For example, predictive models can forecast potential revenue shortfalls based on macroeconomic indicators or predict the impact of price changes on sales volume. This enables businesses to make data-driven decisions regarding resource allocation, potentially mitigating risks and maximizing opportunities. A retail company, for example, could use predictive analytics to forecast demand for specific products during peak seasons, ensuring adequate inventory levels and avoiding stockouts or overstocking.
Workflow for Budget Creation and Monitoring with Integrated Systems
A typical workflow for budget creation and monitoring with integrated systems might involve the following steps:
- Data Collection and Consolidation: Gathering relevant financial and operational data from various sources (accounting software, CRM, ERP, etc.) and consolidating it into a central BI platform.
- Historical Analysis: Utilizing BI tools to analyze historical data, identifying trends, patterns, and outliers to inform budget assumptions.
- Budget Creation: Developing the budget using the insights gained from the historical analysis and incorporating predictive analytics to forecast future performance.
- Budget Allocation: Distributing the budget across different departments and projects based on strategic priorities and performance indicators.
- Real-time Monitoring: Continuously monitoring actual performance against the budget using real-time dashboards and alerts, allowing for timely intervention if variances occur.
- Variance Analysis: Investigating and analyzing budget variances to identify the root causes and make necessary adjustments to the budget or operational plans.
- Reporting and Forecasting: Generating regular reports on budget performance and using the insights to refine future forecasts and budgets.
Streamlined Operations and Efficiency
Integrating accounting and business intelligence (BI) significantly streamlines operations and boosts overall efficiency. By connecting financial data with operational data, businesses gain a holistic view, enabling them to identify bottlenecks, optimize processes, and improve resource allocation. This integration allows for data-driven decision-making, moving away from gut feelings and towards informed strategies.
The combination of accounting and BI systems automates many previously manual tasks, reducing the potential for human error and freeing up valuable employee time. This automation leads to cost savings and increased productivity across the organization. Imagine a scenario where previously disparate data sources are now seamlessly linked, providing a unified, real-time view of the business.
Automation Reduces Manual Data Entry and Minimizes Errors
Automation significantly reduces manual data entry, a notorious source of errors in traditional accounting systems. For instance, integrating accounting software with a BI platform allows for automated data imports from various sources, such as sales systems, inventory management systems, and customer relationship management (CRM) systems. This eliminates the need for manual data entry, minimizing the risk of human error, such as typos or incorrect data entry. Real-time data synchronization further enhances accuracy and ensures that all reports reflect the most up-to-date information. A company using such a system might find its error rate in invoice processing drop from 5% to less than 1%, resulting in significant time and cost savings. The automated reconciliation of bank statements and other financial documents is another prime example of reduced manual effort and improved accuracy.
Efficiency Gains of Integrated Systems Compared to Separate Systems
Integrated accounting and BI systems offer substantial efficiency gains compared to traditional, separate systems. In traditional systems, data often resides in silos, requiring manual data extraction, transformation, and loading (ETL) processes to generate reports. This process is time-consuming, prone to errors, and often delays critical decision-making. Integrated systems, on the other hand, provide a unified view of the data, eliminating the need for cumbersome ETL processes. Reports can be generated quickly and easily, providing real-time insights into business performance. For example, a retail company using separate systems might spend hours each week compiling sales data from various stores. With an integrated system, this data is automatically consolidated, providing immediate access to key performance indicators (KPIs) like sales per store, average transaction value, and inventory turnover.
Key Operational Improvements and Their Impact on Overall Efficiency
The integration of accounting and BI leads to several key operational improvements:
- Faster Reporting and Analysis: Real-time data access enables quicker generation of financial reports and operational dashboards, facilitating timely decision-making.
- Improved Inventory Management: Accurate inventory data provides insights into stock levels, reducing storage costs and preventing stockouts or overstocking.
- Enhanced Customer Relationship Management (CRM): Integrating CRM data with accounting data allows for a deeper understanding of customer behavior and profitability, leading to better customer service and targeted marketing campaigns.
- Optimized Resource Allocation: Data-driven insights into resource utilization help in optimizing processes and improving resource allocation, leading to cost savings and increased productivity.
- Reduced Operational Costs: Automation of manual processes and improved efficiency lead to a significant reduction in operational costs.
These improvements collectively contribute to a substantial increase in overall operational efficiency, allowing businesses to operate more smoothly and profitably.
Better Risk Management
Integrating accounting and business intelligence systems significantly enhances an organization’s ability to proactively identify, assess, and mitigate financial risks. The real-time data flow and analytical capabilities offered by such integration provide a comprehensive view of the financial landscape, allowing for more informed and timely risk management decisions.
The seamless flow of data between accounting and BI systems enables a more holistic understanding of risk exposure. Instead of relying on disparate data sources and manual processes, integrated systems provide a unified view, allowing for a more accurate and comprehensive risk assessment. This integrated approach facilitates a shift from reactive risk management to proactive risk mitigation.
Real-time Fraud Detection
Real-time data analysis, a key benefit of integrated systems, allows for the immediate detection of potential fraudulent activities. For example, anomaly detection algorithms can identify unusual transaction patterns, such as unusually large payments to a specific vendor or a sudden surge in expenses in a particular department. These anomalies can trigger alerts, prompting immediate investigation and potentially preventing significant financial losses. Furthermore, the comparison of actual financial data against budgets and forecasts can highlight discrepancies that may indicate fraudulent behavior. For instance, if actual sales figures are significantly lower than projected, coupled with unusually high expense reports, this may signal a need for further scrutiny.
Data Visualization for Risk Understanding
Data visualization plays a crucial role in understanding and managing risk. Interactive dashboards can display key risk indicators (KRIs) in a clear and concise manner, allowing stakeholders to quickly grasp the overall risk profile of the organization. For instance, a dashboard could show the concentration of risk in specific areas, such as accounts receivable or inventory, using color-coded maps or charts. This visual representation facilitates quicker identification of areas requiring attention and allows for more effective resource allocation to mitigate those risks. Furthermore, trend analysis through visualized data can reveal emerging risks, enabling proactive measures to be implemented before they escalate into significant problems.
Holistic Risk View: A Visual Representation
Imagine a dashboard displaying interconnected circles representing different risk factors. The size of each circle corresponds to the magnitude of the risk. For example, a large circle representing “credit risk” might be connected to smaller circles representing “customer concentration” and “economic downturn.” The lines connecting the circles indicate the relationships between the risks, showing how a change in one area can impact others. A similar network could depict operational risks, showing the impact of supply chain disruptions on production and sales. The dashboard would also incorporate real-time data updates, allowing for dynamic visualization of the evolving risk landscape. This holistic view provides a clear understanding of interconnected risks and facilitates a more comprehensive and effective risk mitigation strategy.
Improved Customer Relationship Management (CRM)

Integrating accounting and business intelligence data offers a powerful way to understand customers more deeply, moving beyond simple transaction history to gain insights into their behavior, preferences, and lifetime value. This enhanced understanding forms the bedrock of a more effective and profitable CRM strategy.
By combining financial data (purchase history, payment patterns, outstanding balances) with operational data (website activity, customer service interactions, marketing campaign responses), businesses can create a holistic view of each customer. This integrated approach reveals valuable patterns and trends that would be invisible when analyzing data in silos.
Customer Segmentation Based on Integrated Data Analysis
Analyzing integrated data allows for far more nuanced customer segmentation than traditional methods. Instead of simply segmenting by demographics, businesses can create segments based on profitability, purchase frequency, product affinity, or even predicted churn risk. For example, a company might identify a high-value segment of customers who consistently purchase premium products and have a history of on-time payments. Conversely, they could identify a low-value segment of customers with infrequent purchases and a history of late payments. This granular segmentation allows for highly targeted marketing and customer service strategies. Another example could be segmenting customers based on their engagement with different marketing channels – identifying those who respond best to email versus social media, allowing for optimized resource allocation.
Targeted Marketing Campaigns and Improved Customer Retention, The Benefits of Integrating Accounting and Business Intelligence
With precise customer segmentation, marketing campaigns become significantly more effective. Instead of broadcasting generic messages, businesses can tailor campaigns to resonate with specific customer segments. For instance, the high-value customer segment mentioned earlier might receive personalized offers, exclusive discounts, or invitations to loyalty programs. The low-value segment, on the other hand, might receive targeted promotions designed to encourage repeat purchases or improve payment behavior. This precision increases conversion rates, boosts customer lifetime value, and ultimately improves customer retention. A company offering subscription boxes could use this data to predict which customers are likely to cancel and proactively offer incentives to retain them.
Personalized Customer Service and Support
Integrated data enables personalized customer service interactions. Service representatives can access a complete customer history, including past purchases, service requests, and payment information, providing them with the context needed to resolve issues quickly and efficiently. This personalized approach increases customer satisfaction and loyalty. For example, a customer calling about a product malfunction can have their history immediately accessed, potentially revealing previous similar issues or preferences, allowing for a faster and more tailored solution. This contrasts sharply with a situation where the representative must manually gather this information, leading to delays and frustration.
Enhanced Reporting and Data Visualization
Integrating accounting and business intelligence (BI) dramatically enhances reporting capabilities, moving beyond static spreadsheets to dynamic, interactive dashboards and reports. This allows for a more insightful and comprehensive understanding of financial performance and operational efficiency, ultimately leading to better decision-making. The ability to visualize data effectively is crucial in communicating complex information clearly and concisely to stakeholders at all levels.
The power of integrated systems lies in their ability to consolidate data from various sources – sales, inventory, marketing, and finance – providing a holistic view of the business. This unified perspective is far more valuable than isolated data points, enabling a deeper understanding of cause-and-effect relationships and revealing trends that might otherwise go unnoticed. This holistic view empowers more strategic and effective decision-making across the organization.
Advantages of Dashboards and Interactive Reports
Dashboards provide a high-level overview of key performance indicators (KPIs), presenting critical information at a glance. Interactive reports allow users to drill down into specific data points, exploring details and uncovering hidden patterns. This combination empowers users to quickly identify areas needing attention and to make data-driven decisions efficiently. For example, a sales dashboard might show overall revenue, sales by region, and conversion rates, while an interactive report allows users to explore the details behind each metric, such as individual sales transactions or marketing campaign performance.
Examples of Effective Data Visualizations
Effective data visualization simplifies complex information. A well-designed chart or graph can instantly communicate trends and patterns that would be difficult to discern from raw data. For instance, a line graph showing revenue growth over time clearly illustrates trends, while a bar chart comparing sales across different product lines provides an easy comparison. Geographical maps can visually represent sales performance by region, highlighting high-performing and underperforming areas. Heatmaps can visually represent the concentration of sales across different product categories or customer segments.
Types of Reports Enabled by Integrated Systems
Integrated accounting and BI systems facilitate the creation of a wide array of reports. These go beyond traditional financial statements to include operational reports, customer profitability analysis, and predictive modeling. Examples include: profit and loss statements broken down by product line, customer churn rate analysis, inventory turnover reports, and sales forecasting based on historical data and market trends. The ability to generate customized reports tailored to specific needs further enhances decision-making capabilities.
Sample Financial Dashboard
The following table represents a sample dashboard displaying key financial and operational metrics:
| Metric | Current Month | Previous Month | Year-to-Date |
|---|---|---|---|
| Revenue | $150,000 | $120,000 | $1,200,000 |
| Gross Profit | $75,000 | $60,000 | $600,000 |
| Net Profit | $30,000 | $24,000 | $240,000 |
| Customer Acquisition Cost (CAC) | $50 | $60 | $55 |
This dashboard provides a quick overview of key financial performance indicators, allowing for immediate identification of trends and potential areas for improvement. Further investigation through interactive reports can provide more granular details and insights.
Final Thoughts: The Benefits Of Integrating Accounting And Business Intelligence
In conclusion, integrating accounting and business intelligence offers a compelling pathway to enhanced decision-making, streamlined operations, and a more robust understanding of the business landscape. By leveraging the power of integrated data, organizations can move beyond reactive problem-solving to proactive strategic planning. The resulting improvements in financial forecasting, risk management, and customer relationship management ultimately contribute to a more efficient, profitable, and resilient business. Embracing this integration is not just an operational upgrade; it’s a strategic investment in future growth and sustained competitive advantage.
Commonly Asked Questions
What are the initial costs associated with integrating accounting and business intelligence systems?
Initial costs vary greatly depending on the size and complexity of your business, the existing software infrastructure, and the chosen integration solutions. Expect costs related to software licenses, implementation services, data migration, and potentially employee training.
How long does it typically take to integrate accounting and business intelligence systems?
Implementation timelines depend on the scale of the project and the complexity of the systems involved. Smaller integrations might take a few weeks, while larger projects could extend over several months.
What level of technical expertise is required to manage an integrated system?
The required expertise depends on the complexity of the system. While some systems offer user-friendly interfaces, dedicated IT support or specialized personnel may be necessary for advanced features and troubleshooting.
What are the potential risks associated with integrating accounting and business intelligence systems?
Potential risks include data security breaches, integration failures, and the need for significant employee retraining. Careful planning, robust security measures, and thorough testing can mitigate these risks.
Notice Financial Planning for Self-Employed Individuals for recommendations and other broad suggestions.