


Key Financial Ratios Every Business Should Monitor are crucial for understanding a company’s financial health and making informed decisions. Understanding these ratios allows businesses to assess liquidity, profitability, solvency, and operational efficiency, providing a comprehensive view of their performance. Ignoring these key indicators can lead to missed opportunities, poor resource allocation, and ultimately, financial distress. This guide will explore the most important ratios and how to interpret them effectively.
Regular monitoring of these key financial metrics enables proactive adjustments to business strategies, ensuring sustainable growth and minimizing financial risks. By understanding the strengths and weaknesses revealed through ratio analysis, businesses can identify areas needing improvement, optimize operations, and make data-driven choices that enhance their overall financial performance and long-term viability.
Introduction
Financial ratios are crucial tools for understanding a business’s financial health and performance. They provide a standardized way to analyze key aspects of a company’s operations, allowing for meaningful comparisons across time and against industry benchmarks. Regular monitoring of these ratios is essential for effective decision-making and proactive management of financial risks.
Key financial ratios are calculations derived from a company’s financial statements (balance sheet, income statement, and cash flow statement) that express the relationship between different financial elements. These relationships offer insights into profitability, liquidity, solvency, and efficiency. Understanding these relationships empowers businesses to make informed choices about pricing, investments, expansion, and operational strategies.
Benefits of Regular Ratio Monitoring
Consistent monitoring of key financial ratios provides numerous benefits for a business’s long-term health and stability. Regular analysis allows for early identification of potential problems, enabling timely intervention and corrective actions. This proactive approach minimizes the risk of financial distress and allows for more effective resource allocation. Furthermore, monitoring ratios helps track progress towards strategic goals and provides valuable data for performance evaluations. Finally, strong financial ratios can attract investors and lenders, improving access to capital.
Negative Impacts of Neglecting Ratio Monitoring
Ignoring the crucial information provided by financial ratio analysis can lead to significant negative consequences. For example, a company that fails to monitor its liquidity ratios (such as the current ratio or quick ratio) might find itself unable to meet its short-term obligations, leading to cash flow crises and potential bankruptcy. Similarly, neglecting profitability ratios (like gross profit margin or net profit margin) can mask declining performance, preventing timely adjustments to pricing strategies or cost-cutting measures. Ignoring debt ratios (such as the debt-to-equity ratio) can result in excessive debt burdens, hindering future growth and increasing vulnerability to economic downturns. A real-world example is the collapse of several businesses during the 2008 financial crisis, largely due to their failure to properly manage leverage and liquidity ratios. Their inability to anticipate and react to changing market conditions exacerbated existing weaknesses, leading to widespread failures.
The Crucial Role of Financial Ratios in Decision-Making
Financial ratios are not merely numbers; they are vital indicators that illuminate the underlying health and performance of a business. They provide a clear picture of the company’s financial strengths and weaknesses, guiding strategic decisions and shaping future actions. By regularly analyzing key ratios, businesses can anticipate potential challenges, optimize resource allocation, and ultimately enhance their overall financial performance and long-term sustainability. Understanding these ratios is paramount for making informed choices about investments, pricing strategies, operational efficiency, and overall business growth.
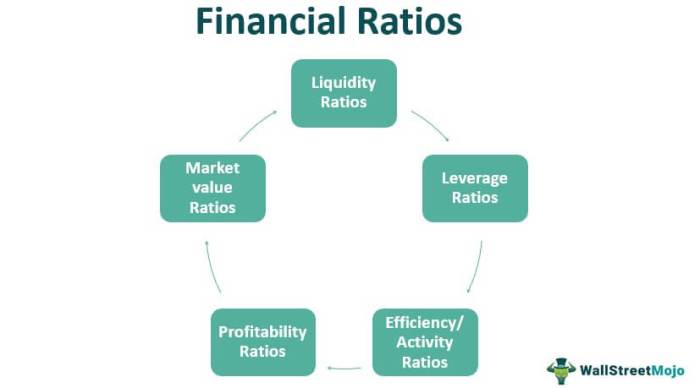
Liquidity Ratios

Liquidity ratios are crucial indicators of a company’s ability to meet its short-term financial obligations. They assess a business’s capacity to convert assets into cash quickly to pay off debts that are due within a year. Understanding these ratios is essential for both internal management and external stakeholders like investors and creditors.
Current Ratio
The current ratio is a fundamental liquidity ratio that measures a company’s ability to pay off its current liabilities (due within one year) with its current assets (assets that can be converted to cash within one year). A higher current ratio generally suggests better short-term financial health.
The formula for the current ratio is: Current Ratio = Current Assets / Current Liabilities
For example, a company with $100,000 in current assets and $50,000 in current liabilities has a current ratio of 2.0 (100,000 / 50,000 = 2.0). This indicates that the company has twice the amount of current assets as current liabilities, suggesting a strong ability to meet its short-term obligations. However, it’s important to note that an excessively high current ratio might also indicate inefficient use of assets.
Quick Ratio
The quick ratio, also known as the acid-test ratio, provides a more conservative measure of liquidity than the current ratio. It excludes inventory from current assets, as inventory may not be easily or quickly converted into cash. This offers a stricter assessment of a company’s immediate ability to pay its debts.
The formula for the quick ratio is: Quick Ratio = (Current Assets – Inventory) / Current Liabilities
Using the same example as above, if the company has $20,000 in inventory, the quick ratio would be 1.6 ((100,000 – 20,000) / 50,000 = 1.6). This still indicates a good liquidity position, but the lower number compared to the current ratio highlights the importance of inventory turnover in meeting short-term obligations. A lower quick ratio might signal potential liquidity issues if the company relies heavily on quick inventory sales to meet its obligations.
Comparison of Current Ratio and Quick Ratio
The current ratio and quick ratio both assess short-term liquidity, but they differ in their inclusion of inventory. The current ratio provides a broader picture of liquidity, while the quick ratio offers a more stringent and conservative view. The choice of which ratio to prioritize depends on the specific industry and the nature of the business. For example, a retailer heavily reliant on inventory sales might have a lower quick ratio than a service-based business, but this doesn’t necessarily indicate poorer liquidity if inventory turnover is efficient.
| Ratio Name | Formula | Interpretation | Limitations |
|---|---|---|---|
| Current Ratio | Current Assets / Current Liabilities | Higher ratio indicates greater ability to meet short-term obligations. However, an excessively high ratio might suggest inefficient asset utilization. | Includes inventory, which may not be quickly convertible to cash. Doesn’t consider the quality of current assets. |
| Quick Ratio | (Current Assets – Inventory) / Current Liabilities | More conservative measure of liquidity, excluding less liquid inventory. A higher ratio suggests stronger immediate debt-paying ability. | Excludes inventory, potentially underestimating liquidity in businesses with high inventory turnover. Doesn’t consider the quality of current assets. |
Profitability Ratios
Profitability ratios are crucial indicators of a business’s ability to generate earnings from its operations. They provide insights into how efficiently a company is using its resources to create profit and ultimately, value for its stakeholders. Analyzing these ratios alongside liquidity and solvency ratios paints a comprehensive picture of a business’s financial health.
Gross Profit Margin
The Gross Profit Margin reveals the profitability of a company’s core operations after deducting the direct costs of producing goods or services. It highlights the efficiency of production and pricing strategies. A higher gross profit margin indicates greater efficiency in managing production costs and/or stronger pricing power. It’s calculated as:
Gross Profit Margin = (Revenue – Cost of Goods Sold) / Revenue * 100%
For example, a company with $1 million in revenue and $600,000 in cost of goods sold has a gross profit margin of 40%. This suggests that 40% of the revenue is available to cover operating expenses and generate profit. A consistently low gross profit margin may signal issues with production efficiency, pricing strategies, or increasing input costs.
Net Profit Margin, Key Financial Ratios Every Business Should Monitor
The Net Profit Margin shows the percentage of revenue that translates into actual profit after all expenses, including operating costs, interest, and taxes, are deducted. It provides a comprehensive overview of overall profitability and operational efficiency. A higher net profit margin indicates greater efficiency in managing all aspects of the business, from production to administration. It’s calculated as:
Net Profit Margin = Net Profit / Revenue * 100%
If the same company from the previous example has a net profit of $100,000, its net profit margin is 10%. This indicates that only 10% of the revenue remains as profit after all expenses are considered. A significant difference between the gross and net profit margins suggests high operating expenses that warrant further investigation.
Return on Assets (ROA) and Return on Equity (ROE)
Return on Assets (ROA) and Return on Equity (ROE) measure how effectively a company utilizes its assets and equity to generate profit. ROA considers all assets, while ROE focuses specifically on the return generated for shareholders’ investments. Several factors influence both, including operational efficiency, asset management, financial leverage, and the overall economic environment. Higher ROA and ROE generally indicate better management and higher profitability.
ROA is calculated as:
ROA = Net Profit / Total Assets * 100%
ROE is calculated as:
ROE = Net Profit / Shareholder Equity * 100%
Summary of Profitability Ratios
The following list summarizes the three key profitability ratios and their interpretation:
- Gross Profit Margin: Measures the profitability of core operations after deducting direct costs. High values indicate efficient production and/or strong pricing. Low values may signal issues with production costs or pricing strategies.
- Net Profit Margin: Shows the percentage of revenue that remains as profit after all expenses. High values indicate strong overall operational efficiency. Low values suggest high operating expenses or low revenue.
- Return on Assets (ROA): Measures the return generated on total assets. High values indicate efficient asset utilization and strong profitability. Low values may suggest underutilized assets or inefficient operations.
- Return on Equity (ROE): Measures the return generated on shareholder equity. High values indicate strong profitability relative to shareholder investment. Low values may signal inefficient use of equity capital.
Solvency Ratios

Solvency ratios provide crucial insights into a business’s long-term financial health and its ability to meet its long-term obligations. Unlike liquidity ratios, which focus on short-term obligations, solvency ratios assess a company’s overall financial stability and its capacity to withstand economic downturns or unexpected events. Understanding these ratios is vital for investors, creditors, and business owners alike to make informed decisions about the future of the company.
Debt-to-Equity Ratio
The Debt-to-Equity Ratio measures the proportion of a company’s financing that comes from debt relative to equity. A higher ratio indicates greater reliance on borrowed funds, which can increase financial risk. The calculation is straightforward:
Debt-to-Equity Ratio = Total Debt / Total Equity
For example, if a company has total debt of $500,000 and total equity of $1,000,000, its Debt-to-Equity ratio is 0.5 (500,000/1,000,000). This suggests a relatively balanced capital structure. A ratio significantly above 1 indicates a higher level of financial leverage and increased risk. Conversely, a lower ratio suggests a more conservative approach to financing.
Debt-to-Asset Ratio
The Debt-to-Asset Ratio shows the proportion of a company’s assets financed by debt. This ratio offers a broader perspective on a company’s financial leverage compared to the Debt-to-Equity ratio, as it considers all assets, not just those financed by equity. The calculation is:
Debt-to-Asset Ratio = Total Debt / Total Assets
A higher Debt-to-Asset ratio suggests a higher degree of financial risk. For instance, a company with a ratio of 0.7 means that 70% of its assets are financed by debt, leaving only 30% financed by equity. This indicates substantial financial risk, as a significant portion of assets is financed by debt that must be repaid.
Times Interest Earned Ratio
The Times Interest Earned (TIE) ratio assesses a company’s ability to meet its interest obligations on outstanding debt. It measures the company’s earnings before interest and taxes (EBIT) relative to its interest expense. The calculation is:
Times Interest Earned Ratio = Earnings Before Interest and Taxes (EBIT) / Interest Expense
A TIE ratio of 2 or higher generally indicates a company’s ability to comfortably cover its interest payments. A lower ratio suggests a higher risk of defaulting on debt obligations. For example, a TIE ratio of 1.5 suggests that a company’s EBIT is only 1.5 times its interest expense; a ratio closer to 1 signifies significant financial strain and potential difficulties in meeting interest payments.
High Debt Ratios and Financial Risk: A Visual Representation
Imagine a seesaw. One side represents debt, and the other side represents equity. A seesaw balanced indicates a healthy debt-to-equity ratio. As more weight (debt) is added to one side, the seesaw tilts precariously, representing increased financial risk. The higher the debt relative to equity, the greater the risk of the company tipping over (financial distress or bankruptcy). This visual illustrates how an increasing debt burden significantly impacts a company’s financial stability and increases its vulnerability to economic shocks or unexpected events.
Efficiency Ratios
Efficiency ratios provide insights into how effectively a business utilizes its assets and manages its resources to generate sales and profits. Analyzing these ratios helps identify areas for improvement in operational efficiency and ultimately, profitability. A strong performance in efficiency ratios indicates a well-managed and productive business.
Inventory Turnover Ratio
The Inventory Turnover Ratio measures how efficiently a company manages its inventory. A higher ratio generally suggests efficient inventory management, while a lower ratio may indicate overstocking, obsolete inventory, or slow sales. This ratio is crucial for businesses that hold significant inventory, such as retailers or manufacturers. Analyzing this ratio allows businesses to optimize inventory levels, reduce storage costs, and minimize the risk of obsolescence. The formula is:
Inventory Turnover Ratio = Cost of Goods Sold / Average Inventory
The average inventory is typically calculated as the average of the beginning and ending inventory for a given period. For example, a company with a Cost of Goods Sold of $1,000,000 and an average inventory of $200,000 has an inventory turnover ratio of 5. This indicates that the company sells and replaces its entire inventory five times during the period.
Accounts Receivable Turnover Ratio
The Accounts Receivable Turnover Ratio reflects how effectively a company manages its credit and collects payments from customers. A higher ratio implies efficient credit management and prompt collection of receivables. Conversely, a low ratio might signal problems with credit policies, difficulties in collecting payments, or potentially even bad debts. Monitoring this ratio is particularly important for businesses that extend credit to their customers. Effective credit management is crucial for maintaining healthy cash flow. The formula is:
Accounts Receivable Turnover Ratio = Net Credit Sales / Average Accounts Receivable
Average accounts receivable is calculated similarly to average inventory. A company with net credit sales of $800,000 and average accounts receivable of $100,000 has a ratio of 8, suggesting efficient collection of payments.
Asset Turnover Ratio
The Asset Turnover Ratio indicates how efficiently a company utilizes its assets to generate sales. It measures the sales generated per dollar of assets. A higher ratio suggests efficient asset utilization, while a lower ratio may indicate underutilization of assets or inefficient asset management. This ratio is a key indicator of overall operational efficiency and profitability. Improving this ratio often involves strategies to optimize asset usage and reduce unproductive assets. The formula is:
Asset Turnover Ratio = Net Sales / Average Total Assets
Average total assets are calculated by averaging the beginning and ending total assets for the period. A company with net sales of $1,500,000 and average total assets of $750,000 has an asset turnover ratio of 2, indicating that for every dollar of assets, the company generates $2 in sales.
Summary of Efficiency Ratios
| Ratio | Formula | Interpretation |
|---|---|---|
| Inventory Turnover Ratio | Cost of Goods Sold / Average Inventory | Higher is better; indicates efficient inventory management. |
| Accounts Receivable Turnover Ratio | Net Credit Sales / Average Accounts Receivable | Higher is better; indicates efficient credit and collection practices. |
| Asset Turnover Ratio | Net Sales / Average Total Assets | Higher is better; indicates efficient asset utilization. |
Using Financial Ratios for Strategic Decision Making: Key Financial Ratios Every Business Should Monitor
Financial ratios are not merely numbers; they are powerful tools for strategic decision-making. By analyzing these ratios, businesses gain crucial insights into their financial health, operational efficiency, and overall performance. This allows for informed decisions regarding investment, operational improvements, and securing funding. Understanding how to interpret and utilize these ratios is key to navigating the complexities of the business world.
Financial ratios provide a comprehensive view of a company’s performance, allowing for both internal analysis and external benchmarking. They offer a standardized method for comparing performance across time periods, different business units, and even against competitors within the same industry. This comparative analysis reveals areas of strength and weakness, guiding strategic choices and resource allocation.
Check what professionals state about How to Identify and Minimize Financial Risks Using Accounting and its benefits for the industry.
Investment Decisions Informed by Financial Ratios
Financial ratios play a critical role in guiding investment decisions. For example, a high return on equity (ROE) suggests a company is effectively utilizing its shareholders’ investments, making it a potentially attractive investment opportunity. Conversely, a low profit margin might indicate operational inefficiencies or pricing issues, prompting further investigation before committing capital. Investors frequently examine a company’s debt-to-equity ratio to assess its financial risk. A high ratio suggests a heavily leveraged company, potentially indicating higher risk but also potentially higher returns. Analyzing ratios like the price-to-earnings (P/E) ratio helps investors determine whether a company’s stock is overvalued or undervalued compared to its earnings. A low P/E ratio might suggest an undervalued stock, while a high P/E ratio could indicate overvaluation or high growth expectations.
Identifying Areas for Operational Improvement
Financial ratios can pinpoint areas ripe for operational improvements. For instance, a high inventory turnover ratio indicates efficient inventory management, while a low ratio might signal overstocking, leading to increased storage costs and potential obsolescence. Similarly, a low accounts receivable turnover ratio might suggest inefficient credit collection practices, leading to tied-up capital. Analyzing these ratios helps businesses identify bottlenecks and inefficiencies, guiding them towards streamlining processes and improving profitability. For example, a company with a high operating expense ratio compared to its competitors might investigate areas for cost reduction, such as negotiating better supplier contracts or improving energy efficiency.
Comparative Ratio Analysis Over Time and Across Competitors
Comparing financial ratios over time (trend analysis) and against industry competitors provides valuable context and insights. A declining profit margin over several years, even with increasing revenue, might signal a need to re-evaluate pricing strategies or cost structures. Comparing key ratios like return on assets (ROA) and net profit margin to industry averages reveals a company’s relative performance. A company consistently outperforming its competitors on these metrics demonstrates strong financial management and competitive advantage. This comparative analysis is essential for identifying best practices, setting realistic targets, and adjusting strategies to maintain or improve market position.
Using Financial Ratios to Support Business Plans and Funding Requests
Financial ratios are crucial elements in supporting business plans and funding requests. Investors and lenders use these ratios to assess the financial viability and risk associated with a business. A well-structured business plan will incorporate key financial ratios, demonstrating the company’s past performance, current financial health, and projected future performance. For example, a strong ROE and a low debt-to-equity ratio demonstrate financial stability and would increase the likelihood of securing funding. Presenting a detailed analysis of key ratios, including comparisons to industry benchmarks, strengthens the credibility of the business plan and enhances the chances of securing investment or a loan. A clear presentation of how the business intends to improve key ratios in the future further reinforces the plan’s viability.
Final Thoughts
Mastering the art of interpreting key financial ratios is paramount for any business aiming for sustainable success. By consistently monitoring these metrics and understanding their implications, businesses can gain valuable insights into their operational efficiency, financial stability, and overall performance. This proactive approach empowers data-driven decision-making, leading to improved resource allocation, strategic planning, and ultimately, enhanced profitability and long-term growth. Remember, consistent monitoring and analysis are key to utilizing this powerful tool effectively.
FAQ Overview
What is the difference between the Current Ratio and the Quick Ratio?
The Current Ratio includes all current assets in the calculation, while the Quick Ratio excludes inventory, providing a more conservative measure of short-term liquidity.
How often should I monitor my financial ratios?
Ideally, financial ratios should be monitored monthly or quarterly to catch trends early. The frequency depends on the size and complexity of the business.
What if my ratios are significantly worse than my competitors’?
This indicates areas for improvement. Analyze the individual ratios to pinpoint weaknesses and develop strategies to address them. Consider benchmarking against industry averages as well.
Can I use financial ratios to secure funding?
Yes, strong financial ratios demonstrate the health and stability of your business, making it a more attractive prospect for lenders and investors.