


How to Use Accounting Data to Strengthen Financial Decision-Making is more than just crunching numbers; it’s about unlocking the hidden narratives within your financial statements. This guide provides a practical framework for leveraging accounting data to make informed, strategic decisions, moving beyond simple bookkeeping to a deeper understanding of your organization’s financial health and future potential. We’ll explore key financial statements, profitability metrics, liquidity assessments, and cash flow analysis, demonstrating how these elements work together to create a robust decision-making process.
From understanding the nuances of key ratios to mastering budgeting and forecasting techniques, this exploration will equip you with the tools to confidently navigate financial complexities. We’ll also delve into investment appraisal methods and strategic planning, showing how accounting data can illuminate the path towards sustainable growth and profitability. By the end, you’ll be equipped to transform raw accounting data into actionable insights.
Understanding Key Financial Statements
Effective financial decision-making hinges on a thorough understanding and interpretation of key financial statements. These statements – the income statement, balance sheet, and cash flow statement – provide a comprehensive picture of a company’s financial health, allowing for informed strategic choices. Analyzing these statements individually and in conjunction with each other unveils valuable insights into profitability, liquidity, and solvency.
The Income Statement: Measuring Profitability
The income statement, also known as the profit and loss (P&L) statement, summarizes a company’s revenues and expenses over a specific period, typically a quarter or a year. It reveals the company’s profitability by calculating net income (or net loss). A detailed income statement breaks down revenues from various sources and categorizes expenses, offering a clear view of where the company is generating revenue and where its costs are concentrated. This allows for identifying areas for improvement in cost control and revenue generation. For example, a consistently high cost of goods sold (COGS) compared to revenue might indicate a need to renegotiate supplier contracts or improve operational efficiency.
The Balance Sheet: Assessing Financial Position
The balance sheet presents a snapshot of a company’s assets, liabilities, and equity at a specific point in time. It adheres to the fundamental accounting equation: Assets = Liabilities + Equity. Analyzing the balance sheet reveals the company’s financial structure, its liquidity (ability to meet short-term obligations), and its solvency (ability to meet long-term obligations). For instance, a high ratio of current assets to current liabilities suggests strong short-term liquidity, while a healthy equity-to-asset ratio indicates a strong financial foundation. A company with excessive debt relative to equity might be considered riskier than a company with lower debt levels.
The Cash Flow Statement: Tracking Cash Movements
The cash flow statement tracks the movement of cash both into and out of a company during a specific period. Unlike the income statement, which uses accrual accounting, the cash flow statement focuses solely on cash transactions. It categorizes cash flows into operating activities (day-to-day business operations), investing activities (capital expenditures and investments), and financing activities (debt, equity, and dividends). This statement is crucial for understanding a company’s ability to generate cash, manage its working capital, and fund its growth. A company may report high net income on its income statement but still experience cash flow problems if its receivables are slow to collect or its inventory is tying up significant capital.
Key Financial Ratios and Industry Comparisons
Financial ratios derived from these statements provide valuable insights into a company’s performance. Analyzing these ratios in relation to industry benchmarks is crucial for accurate assessment.
| Ratio | Formula | Interpretation | Industry Example (Retail) |
|---|---|---|---|
| Gross Profit Margin | (Revenue – COGS) / Revenue | Profitability after accounting for direct costs | Typically 30-40% |
| Current Ratio | Current Assets / Current Liabilities | Short-term liquidity | Ideally above 1.5 |
| Debt-to-Equity Ratio | Total Debt / Total Equity | Financial leverage and solvency | Varies significantly, but generally lower is better |
| Return on Equity (ROE) | Net Income / Shareholder’s Equity | Profitability relative to shareholder investment | Benchmark varies significantly based on industry growth and risk |
Analyzing Profitability Metrics
Understanding profitability is crucial for sound financial decision-making. Profitability metrics, derived from accounting data, provide insights into a company’s ability to generate earnings and ultimately, its financial health. Analyzing these metrics over time reveals trends and allows for proactive adjustments to improve performance.
Profitability is assessed using several key ratios, each offering a unique perspective on a company’s financial performance. These ratios utilize data readily available from the income statement, allowing for a comprehensive understanding of the business’s earning power.
Check Payroll Compliance Checklist for Small Businesses to inspect complete evaluations and testimonials from users.
Gross Profit Margin
Gross profit margin measures the profitability of a company’s core operations before considering operating expenses. It is calculated as:
Gross Profit Margin = (Revenue – Cost of Goods Sold) / Revenue * 100%
. A higher gross profit margin indicates greater efficiency in managing production or service delivery costs. For example, a company with a consistently high gross profit margin might be benefiting from economies of scale or superior pricing power. Conversely, a declining gross profit margin could signal rising input costs or increased competition forcing price reductions.
Operating Profit Margin
Operating profit margin reveals the profitability of a company’s operations after deducting operating expenses. It is calculated as:
Operating Profit Margin = Operating Income / Revenue * 100%
. This metric provides a clearer picture of a company’s operational efficiency than gross profit margin, as it incorporates expenses such as salaries, rent, and utilities. A stable or increasing operating profit margin suggests effective cost management and efficient operations. A declining operating profit margin, however, could indicate rising operating expenses or declining sales, necessitating a review of operational strategies. For instance, a company facing increasing competition might see its operating profit margin decline as it invests in marketing and sales to maintain its market share.
Net Profit Margin
Net profit margin represents the overall profitability of a company after all expenses, including taxes and interest, have been deducted. It is calculated as:
Net Profit Margin = Net Income / Revenue * 100%
. This is the most comprehensive measure of profitability, reflecting the ultimate return on sales. A consistently high net profit margin demonstrates strong overall financial health and efficient management across all aspects of the business. A declining net profit margin could signal various issues, from increased competition and reduced pricing power to higher tax burdens or increased financing costs. For example, a company experiencing a decline in net profit margin might investigate ways to reduce interest expenses by refinancing debt or improving its operational efficiency to boost revenue and reduce costs.
Impact of Cost Control Measures on Profitability Metrics
Effective cost control measures directly impact all three profitability metrics. Reducing the cost of goods sold improves the gross profit margin. Streamlining operations and reducing operating expenses boosts the operating profit margin. Careful management of all expenses, including taxes and interest, enhances the net profit margin. For example, implementing lean manufacturing techniques can reduce waste and lower the cost of goods sold, thereby improving gross profit margin. Similarly, negotiating better terms with suppliers or improving inventory management can lead to cost savings and subsequently higher profit margins.
Strategies to Improve Profitability Based on Accounting Data
Analyzing accounting data reveals opportunities to enhance profitability. The following strategies, derived from data analysis, can be implemented:
Careful examination of accounting data is crucial for identifying areas for improvement. The strategies Artikeld below are examples, and the specific approach will depend on the unique circumstances of each business.
- Identify and reduce high-cost areas: Accounting data highlights areas with excessive expenses. Targeted cost reduction efforts can significantly improve margins.
- Improve pricing strategies: Analyze data on competitor pricing and customer price sensitivity to optimize pricing for maximum profitability.
- Enhance operational efficiency: Identify bottlenecks and inefficiencies in operations using data analysis and implement improvements to reduce costs.
- Increase sales volume: Data analysis can reveal market segments with high growth potential, guiding sales and marketing efforts for increased revenue.
- Negotiate better terms with suppliers: Leverage data on purchasing patterns to negotiate more favorable terms with suppliers, reducing costs.
- Invest in technology: Data analysis can justify investments in technology that automate processes and improve efficiency, leading to cost savings.
Assessing Liquidity and Solvency
Understanding a company’s liquidity and solvency is crucial for informed financial decision-making. Liquidity refers to a company’s ability to meet its short-term obligations, while solvency focuses on its ability to meet its long-term obligations. Analyzing both aspects provides a comprehensive picture of a company’s financial health.
Liquidity Ratios
Liquidity ratios assess a company’s ability to pay off its short-term debts. Key ratios offer insights into the immediate financial health of the business. A healthy liquidity position is vital for operational continuity and prevents financial distress.
Current Ratio and Quick Ratio
The current ratio is calculated by dividing current assets by current liabilities:
Current Ratio = Current Assets / Current Liabilities
. A higher current ratio generally indicates better liquidity. However, an excessively high ratio might suggest inefficient asset management. The quick ratio, also known as the acid-test ratio, provides a more conservative measure by excluding inventory from current assets:
Quick Ratio = (Current Assets – Inventory) / Current Liabilities
. This is because inventory may not be easily converted to cash.
Implications of High versus Low Liquidity Ratios
High liquidity ratios suggest a company has ample resources to cover its short-term debts. This can provide financial flexibility and reduce the risk of default. Conversely, low liquidity ratios signal potential difficulties in meeting short-term obligations, increasing the risk of financial distress or even bankruptcy. For example, a company with a consistently low current ratio might struggle to secure credit lines or face difficulties in paying suppliers promptly.
Solvency Ratios
Solvency ratios gauge a company’s ability to meet its long-term obligations and its overall financial stability. These ratios provide insights into a company’s capital structure and its capacity to withstand financial pressures. A strong solvency position is essential for long-term sustainability.
Debt-to-Equity Ratio and Times Interest Earned
The debt-to-equity ratio measures the proportion of a company’s financing that comes from debt relative to equity:
Debt-to-Equity Ratio = Total Debt / Total Equity
. A higher ratio indicates greater reliance on debt financing, which increases financial risk. The times interest earned ratio assesses a company’s ability to cover its interest payments with its earnings:
Times Interest Earned = Earnings Before Interest and Taxes (EBIT) / Interest Expense
. A higher ratio suggests a greater capacity to service debt obligations.
Interpretation of Liquidity and Solvency Ratios
| Ratio | Interpretation | High Value Implications | Low Value Implications |
|---|---|---|---|
| Current Ratio | Current Assets / Current Liabilities | Strong short-term liquidity, low risk of default | Weak short-term liquidity, high risk of default, potential cash flow problems |
| Quick Ratio | (Current Assets – Inventory) / Current Liabilities | Very strong short-term liquidity, even without quick inventory sale | Weak short-term liquidity, significant reliance on inventory conversion to cash |
| Debt-to-Equity Ratio | Total Debt / Total Equity | High financial leverage, higher risk, potentially higher returns | Low financial leverage, lower risk, potentially lower returns |
| Times Interest Earned | EBIT / Interest Expense | Strong ability to cover interest payments, low default risk | Weak ability to cover interest payments, high default risk |
Utilizing Cash Flow Information: How To Use Accounting Data To Strengthen Financial Decision-Making
Analyzing cash flow is crucial for a comprehensive understanding of a company’s financial health, offering insights beyond the static picture presented by the balance sheet and income statement. Cash flow statements reveal the actual movement of cash into and out of the business, providing a more dynamic view of its financial performance and future prospects. This analysis is particularly valuable in identifying potential issues that might be masked by accrual accounting methods used in other financial statements.
Cash flow analysis provides a detailed breakdown of cash inflows and outflows, categorized into operating, investing, and financing activities. Understanding the interplay between these three categories is key to assessing a company’s liquidity, solvency, and overall financial strength. For instance, consistently strong operating cash flow indicates a healthy and sustainable business model, while significant outflows from investing activities might signal aggressive expansion or potential over-investment.
Significance of Analyzing Cash Flows from Operating, Investing, and Financing Activities
Analyzing cash flows from operating, investing, and financing activities provides a holistic view of a company’s financial health. Operating cash flow reflects the cash generated from the core business operations, indicating the company’s ability to generate cash from its day-to-day activities. Positive operating cash flow is a strong indicator of financial health and sustainability. Investing cash flow tracks cash used for acquiring long-term assets (e.g., property, plant, and equipment) and investments in other companies. A high outflow in this category might indicate expansion plans or strategic acquisitions, while a high inflow could signal the sale of assets. Financing cash flow shows the cash flows related to debt, equity, and dividends. This section reveals how the company finances its operations and investments. A large inflow could signify successful fundraising, while a large outflow could indicate significant debt repayments or dividend distributions. Analyzing the relationships between these three categories provides a more complete picture than any single statement alone. For example, a company might report strong profits (net income) but have weak operating cash flow, indicating potential issues with accounts receivable or inventory management.
Examples of Cash Flow Analysis Revealing Potential Issues
Cash flow analysis can uncover issues not readily apparent in other financial statements. For instance, a company might report increasing profits but declining operating cash flow. This discrepancy could signal problems with accounts receivable (customers are slow to pay) or inventory management (excess inventory tying up cash). Conversely, a company with strong profits might have significant capital expenditures (investing activities), suggesting aggressive expansion that could strain its liquidity in the short term. Another example is a company with consistent positive net income but negative operating cash flow over several periods. This could indicate aggressive revenue recognition practices or issues with managing working capital. A detailed cash flow analysis would help to pinpoint the root cause of such discrepancies and allow for corrective action.
Cash Flow Forecasting and Investment Decisions
Cash flow forecasting is a crucial tool for supporting investment decisions. By projecting future cash inflows and outflows, businesses can assess the feasibility of potential investments, such as new equipment, expansion projects, or acquisitions. A well-prepared cash flow forecast helps determine if a company has sufficient liquidity to fund these investments without jeopardizing its financial stability. For example, a company considering a major expansion project can use cash flow forecasting to determine if it can generate enough cash from operations to cover the investment costs and maintain sufficient working capital. If the forecast reveals a shortfall, the company might need to explore alternative financing options or revise its investment plans. This proactive approach reduces the risk of financial distress and improves the chances of successful investment outcomes.
Preparing a Simple Cash Flow Statement
Let’s consider a simplified example. Suppose a company had the following data for a specific period:
Net income: $100,000
Depreciation: $10,000
Increase in accounts receivable: $5,000
Increase in inventory: $8,000
Increase in accounts payable: $3,000
Purchase of equipment: $20,000
Proceeds from issuance of debt: $30,000
Dividend payments: $15,000
A simplified cash flow statement would look like this:
| Cash Flow from Operating Activities | Amount |
|---|---|
| Net Income | $100,000 |
| Depreciation | $10,000 |
| Increase in Accounts Receivable | ($5,000) |
| Increase in Inventory | ($8,000) |
| Increase in Accounts Payable | $3,000 |
| Net Cash from Operating Activities | $100,000 |
| Cash Flow from Investing Activities | Amount |
|---|---|
| Purchase of Equipment | ($20,000) |
| Net Cash from Investing Activities | ($20,000) |
| Cash Flow from Financing Activities | Amount |
|---|---|
| Proceeds from Issuance of Debt | $30,000 |
| Dividend Payments | ($15,000) |
| Net Cash from Financing Activities | $15,000 |
| Net Increase in Cash | $100,000 |
|---|
Note: This is a simplified example and a real-world cash flow statement would be more detailed. It is crucial to consult with accounting professionals for comprehensive financial analysis.
Budgeting and Forecasting
Budgeting and forecasting are crucial for effective financial decision-making. A well-structured budget, informed by historical accounting data, provides a roadmap for achieving financial goals. Forecasting, on the other hand, allows businesses to anticipate future challenges and opportunities, enabling proactive strategic planning. Both processes are deeply intertwined and rely heavily on accurate and insightful analysis of past performance.
Developing a comprehensive budget involves a systematic process that leverages historical accounting data to project future financial performance. This process typically begins with analyzing past revenue and expense patterns to identify trends and seasonality. This analysis forms the basis for realistic revenue projections. Similarly, historical cost data helps in estimating future expenses, factoring in potential price increases or cost-saving initiatives. The budget should also incorporate planned investments, capital expenditures, and other significant financial activities. The final budget should be a detailed plan outlining expected revenues and expenses for a specific period, usually a year.
Developing a Comprehensive Budget, How to Use Accounting Data to Strengthen Financial Decision-Making
The process of developing a comprehensive budget starts with gathering historical financial data. This data includes past income statements, balance sheets, and cash flow statements. By analyzing these statements, businesses can identify trends in revenue generation, cost structures, and profitability. This historical analysis forms the foundation for realistic projections. Next, the business should define its strategic goals for the budget period. These goals should be specific, measurable, achievable, relevant, and time-bound (SMART). The goals will influence the allocation of resources and the overall budget framework. Then, the business develops detailed revenue and expense projections based on the historical data and strategic goals. This involves forecasting sales volume, pricing strategies, and anticipated changes in operating expenses. Finally, the budget is reviewed and approved by relevant stakeholders before implementation. Regular monitoring and adjustments are crucial to ensure the budget remains relevant throughout the budget period.
Forecasting Future Financial Performance
Accurate forecasting is essential for proactive financial management. It involves using historical accounting data, market trends, and industry benchmarks to predict future financial performance. For example, a company might analyze past sales figures, considering factors like seasonal variations and economic indicators, to project future sales revenue. Similarly, cost projections can be made by analyzing historical cost data and anticipating changes in input prices or production efficiency. Forecasting is not merely an extrapolation of past data; it requires incorporating qualitative factors such as market competition, technological advancements, and regulatory changes. Sophisticated forecasting models, including regression analysis and time series analysis, can be employed to improve the accuracy of predictions. Sensitivity analysis can also be used to assess the impact of various scenarios on the forecast.
Variance Analysis in Budget Monitoring
Variance analysis is a crucial tool for monitoring budget performance. It involves comparing actual results to the budgeted figures to identify and analyze deviations. For instance, a company might compare its actual sales revenue to its budgeted revenue for a given period. Any significant difference constitutes a variance, which needs further investigation. Variances can be favorable (e.g., higher-than-budgeted revenue) or unfavorable (e.g., higher-than-budgeted expenses). Understanding the causes of variances is crucial for making necessary adjustments and improving future budget planning. Tools like dashboards and reporting systems can be used to effectively visualize and track variances.
Sample Budget Template
A well-structured budget template helps organize financial information effectively. Below is a simplified example. Note that the level of detail will vary depending on the size and complexity of the business.
| Category | January | February | March |
|---|---|---|---|
| Revenue | $10,000 | $12,000 | $15,000 |
| Cost of Goods Sold | $4,000 | $4,800 | $6,000 |
| Operating Expenses | $3,000 | $3,000 | $3,500 |
| Gross Profit | $6,000 | $7,200 | $9,000 |
| Net Income | $3,000 | $4,200 | $5,500 |
Investment Appraisal Techniques
Accounting data forms the bedrock of effective investment appraisal. By analyzing past and projected financial information, businesses can make informed decisions about which projects to undertake, maximizing returns and minimizing risks. This involves using various techniques to evaluate the financial viability of potential investments.
Investment appraisal techniques utilize accounting data to assess the profitability and financial feasibility of potential projects. These techniques help businesses compare different investment opportunities and select those that offer the best return on investment. Key methods include Net Present Value (NPV) and Internal Rate of Return (IRR), both of which rely heavily on accurate financial projections derived from accounting information.
Net Present Value (NPV) and Internal Rate of Return (IRR)
NPV and IRR are two prominent investment appraisal techniques. NPV calculates the present value of future cash flows, discounted at a predetermined rate (often the company’s cost of capital), and subtracts the initial investment. A positive NPV suggests the project is profitable, while a negative NPV indicates it’s not. IRR, on the other hand, determines the discount rate at which the NPV of a project equals zero. It represents the project’s internal rate of return. Projects with an IRR exceeding the cost of capital are generally considered acceptable.
NPV = Σ (Ct / (1 + r)^t) – C0
where: Ct = net cash inflow during the period t, r = discount rate, t = number of time periods, and C0 = initial investment.
IRR: The discount rate that makes NPV = 0.
For example, consider two projects, A and B. Project A requires an initial investment of $100,000 and is projected to generate net cash inflows of $30,000 annually for five years. Project B requires an initial investment of $150,000 and is projected to generate net cash inflows of $50,000 annually for five years. Using a discount rate of 10%, Project A might have an NPV of $20,000 and an IRR of 15%, while Project B might have an NPV of $35,000 and an IRR of 18%. While Project B has a higher NPV and IRR, the decision of which project to choose may depend on the company’s risk tolerance and available capital.
Comparison of Investment Appraisal Methods
Different appraisal methods have unique strengths and weaknesses. NPV is considered superior because it directly measures the increase in shareholder wealth. However, it requires a precise estimate of the discount rate. IRR is intuitive and easy to understand, but it can lead to multiple solutions (IRR) in certain scenarios, making interpretation complex. Payback Period, another method, simply calculates the time it takes to recover the initial investment, ignoring the time value of money and future cash flows beyond the payback period. This makes it a less comprehensive measure of project profitability.
Sensitivity Analysis in Investment Appraisal
Sensitivity analysis is crucial for evaluating the impact of uncertainties on investment decisions. It involves changing key variables (e.g., sales volume, costs, discount rate) one at a time to observe their effect on the NPV or IRR. For instance, if a project’s NPV is highly sensitive to changes in sales volume, management might consider alternative strategies to mitigate the risk of low sales. This analysis helps to identify the most critical variables and inform risk management strategies. A scenario analysis, extending the sensitivity analysis, can assess the impact of simultaneous changes in multiple variables, providing a more holistic view of potential risks and rewards. For example, a simultaneous decrease in sales volume and increase in raw material costs could drastically reduce the NPV, highlighting the project’s vulnerability to such combined events.
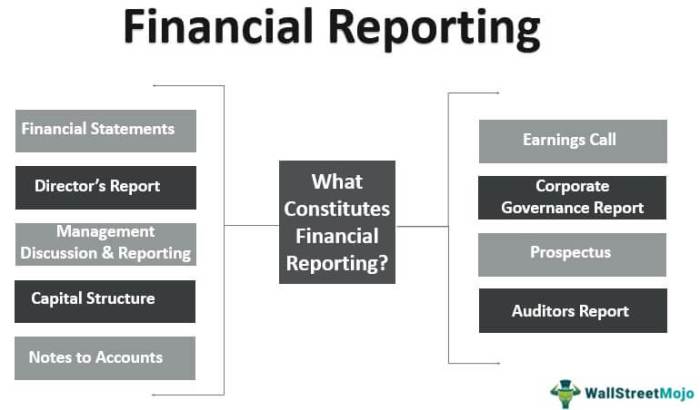
Financial Reporting and Analysis
Effective financial decision-making hinges on the availability of accurate and timely financial reporting. This process transforms raw financial data into meaningful information that allows businesses to understand their past performance, assess their current financial health, and plan for the future. Without reliable reporting, strategic choices become gambles, and the potential for both short-term and long-term failures increases significantly.
The quality of financial reporting directly influences the accuracy of financial analysis. Inaccurate or incomplete data can lead to flawed assessments of profitability, liquidity, and solvency, ultimately hindering the decision-making process. Moreover, timely reporting is crucial for identifying emerging trends and potential problems early on, allowing for proactive interventions rather than reactive crisis management. Delays in reporting can lead to missed opportunities and exacerbate existing challenges.
Importance of Accurate and Timely Financial Reporting
Accurate and timely financial reporting is paramount for effective decision-making. Reliable financial statements provide a clear picture of a company’s financial position, performance, and cash flows. This information is crucial for various stakeholders, including investors, creditors, management, and regulatory bodies. For example, investors use financial reports to evaluate investment opportunities, assessing the company’s profitability, growth potential, and risk profile. Creditors rely on these reports to assess the creditworthiness of the borrower, determining the likelihood of loan repayment. Internal management utilizes the reports for performance monitoring, strategic planning, and resource allocation. Accurate and timely reporting ensures that all stakeholders are working with the same, dependable information, fostering trust and transparency. Delays or inaccuracies can erode confidence and lead to poor decisions.
Potential Biases and Limitations in Accounting Data
Accounting data, while aiming for objectivity, is inherently subject to biases and limitations. One significant limitation is the use of estimations and judgments. Many accounting practices require estimations, such as the useful life of assets or the allowance for doubtful accounts. These estimations can vary depending on the accounting policies adopted, leading to differences in reported financial figures. Another potential bias is the influence of management’s incentives. Managers may manipulate accounting choices to meet certain targets or to portray a more favorable financial picture. Furthermore, accounting standards themselves may have limitations. For example, historical cost accounting may not accurately reflect the current market value of assets, leading to an understated or overstated representation of the company’s net worth. Finally, the focus on quantitative data can overlook qualitative factors, such as employee morale or brand reputation, which can significantly impact a company’s long-term success.
Impact of Accounting Standards on Financial Reporting and Analysis
Accounting standards, such as Generally Accepted Accounting Principles (GAAP) in the United States and International Financial Reporting Standards (IFRS) internationally, significantly impact financial reporting and analysis. These standards establish a common framework for preparing and presenting financial statements, ensuring consistency and comparability across companies. For instance, the adoption of IFRS requires companies to disclose more detailed information about their financial position and performance, which enhances transparency and improves the quality of financial analysis. However, the differences between GAAP and IFRS can complicate the comparison of financial statements from companies using different standards. For example, the treatment of certain items, like research and development expenses, can differ significantly between GAAP and IFRS, making direct comparisons challenging. The consistent application of a specific standard, however, enhances the reliability and credibility of financial reporting, allowing for more meaningful analysis and comparisons.
Best Practices for Interpreting and Using Financial Reports for Decision-Making
Understanding financial reports requires a systematic approach. Before making any decisions based on financial data, it’s crucial to thoroughly analyze the information provided, considering the context and potential limitations.
- Compare data across periods: Analyze trends in key financial metrics over time to identify patterns and assess performance improvements or deteriorations.
- Benchmark against competitors: Comparing financial ratios with industry peers provides insights into relative performance and competitive positioning.
- Consider non-financial factors: While financial data is crucial, don’t overlook qualitative factors such as customer satisfaction, employee morale, and technological advancements.
- Consult with experts: If you lack the necessary expertise, seeking guidance from financial professionals can help ensure accurate interpretation and informed decision-making.
- Understand accounting policies: Familiarize yourself with the company’s accounting policies to understand how financial data has been prepared and the potential implications for analysis.
- Look beyond the bottom line: Don’t solely focus on net income; examine other key metrics like cash flow, return on assets, and debt-to-equity ratio for a comprehensive understanding.
Using Data for Strategic Planning

Accounting data provides the crucial foundation for informed long-term strategic decisions. By analyzing historical financial performance and projecting future trends, businesses can make well-supported choices regarding expansion, diversification, mergers, acquisitions, and other significant initiatives. Ignoring this data can lead to costly mistakes and missed opportunities.
Assessing Financial Feasibility of Strategic Initiatives
Various accounting metrics offer valuable insights into the financial viability of strategic plans. For example, Return on Investment (ROI) helps assess the profitability of a potential expansion project by comparing the net profit generated to the initial investment. Similarly, Net Present Value (NPV) analysis considers the time value of money, discounting future cash flows to determine the present worth of a project. A positive NPV indicates that the project is expected to generate more value than it costs. Analyzing key ratios like debt-to-equity, current ratio, and profit margins provides a comprehensive view of a company’s financial health and its capacity to handle the financial burdens of strategic initiatives. For instance, a low debt-to-equity ratio suggests a company is in a strong position to finance an acquisition through debt.
The Role of Scenario Planning in Strategic Decision-Making
Uncertainty is inherent in strategic planning. Scenario planning helps businesses account for this uncertainty by developing multiple possible future scenarios, each with its own set of assumptions and potential outcomes. For example, a company considering market entry into a new region might develop optimistic, pessimistic, and most likely scenarios, each reflecting different levels of market demand and competitive intensity. By analyzing the financial implications of each scenario, businesses can make more robust and adaptable strategic decisions, mitigating the risks associated with unforeseen events. Sensitivity analysis, which examines the impact of changes in key variables on the financial outcomes, is another valuable tool in scenario planning.
Comparing Financial Implications of Different Strategic Options
The following table compares the projected financial implications of three different strategic options for a hypothetical company: expanding existing product lines, developing a new product line, and acquiring a competitor. These projections are based on internal financial models and market research. Note that these figures are illustrative and would vary significantly based on numerous assumptions.
| Strategic Option | Projected ROI (5 years) | Projected NPV (5 years) | Initial Investment |
|---|---|---|---|
| Expand Existing Product Lines | 15% | $500,000 | $1,000,000 |
| Develop New Product Line | 20% | $750,000 | $2,000,000 |
| Acquire Competitor | 12% | $600,000 | $3,000,000 |
Closing Summary
Mastering the art of using accounting data for financial decision-making is a journey, not a destination. This guide has provided a solid foundation for understanding key financial statements, analyzing profitability and liquidity, and utilizing cash flow information for strategic planning. By consistently applying these principles and staying updated on best practices, you can significantly enhance your ability to make informed financial decisions, leading to improved organizational performance and long-term success. Remember, the power of informed financial decisions lies in the careful analysis and interpretation of your accounting data.
User Queries
What are some common pitfalls to avoid when interpreting accounting data?
Common pitfalls include focusing solely on one metric without considering the broader context, neglecting qualitative factors alongside quantitative data, and failing to account for potential biases or limitations in the data itself.
How frequently should financial statements be analyzed?
The frequency depends on the needs of the business, but monthly or quarterly analysis is generally recommended for effective monitoring and timely adjustments.
What software or tools can assist in financial data analysis?
Many software options exist, ranging from spreadsheet programs like Excel to dedicated accounting and financial analysis software packages. The best choice depends on the size and complexity of the business.
How can I improve my understanding of financial statements?
Consider taking relevant courses or workshops, reading industry publications, and seeking mentorship from experienced financial professionals.