

How to Prepare a Profit and Loss Statement is a crucial skill for any business owner or aspiring entrepreneur. Understanding your financial health requires more than just looking at your bank account; a profit and loss statement (P&L) provides a structured overview of your revenue, expenses, and ultimately, your profitability. This guide will walk you through the process step-by-step, from gathering necessary data to analyzing the final results and using those insights to make informed business decisions. We’ll demystify the complexities of P&L statements, making them accessible and actionable for everyone.
This guide covers the fundamental elements of a P&L statement, including the key components like revenue, cost of goods sold, gross profit, operating expenses, and net profit. We’ll explore different types of revenue and expenses, providing clear examples to illustrate each concept. We will also show you how to collect and organize your financial data accurately, perform essential calculations, and present your P&L statement in a clear, professional format. Finally, we’ll delve into interpreting the results and using your P&L statement to drive strategic business decisions.
Understanding the Basics of a Profit and Loss Statement
A profit and loss statement (P&L), also known as an income statement, is a crucial financial document that summarizes a company’s revenues, costs, and expenses over a specific period, typically a month, quarter, or year. It provides a clear picture of a company’s financial performance and profitability. Understanding its components is essential for making informed business decisions.
Key Components of a Profit and Loss Statement, How to Prepare a Profit and Loss Statement
The P&L statement follows a logical structure, culminating in the calculation of net profit. Each component builds upon the previous one, providing a step-by-step view of how profits are generated and ultimately determined.
Revenue represents the total income generated from the sale of goods or services. Cost of Goods Sold (COGS) encompasses the direct costs associated with producing those goods or services. Subtracting COGS from Revenue yields Gross Profit, which reflects the profit generated before considering operating expenses. Operating Expenses represent the costs of running the business, excluding COGS. Finally, subtracting Operating Expenses from Gross Profit arrives at Net Profit (or Net Loss), the ultimate measure of a company’s profitability during the specified period.
Examples of Revenue and Expenses
The types of revenue and expenses included in a P&L statement vary greatly depending on the nature of the business. However, some common examples are illustrated below.
| Revenue Type | Example | Expense Type | Example |
|---|---|---|---|
| Sales Revenue | Income from selling products or services | Cost of Goods Sold (COGS) | Direct materials, direct labor, manufacturing overhead for a manufacturing company; purchase cost of goods for a retail company |
| Service Revenue | Fees earned from providing professional services (e.g., consulting, legal) | Salaries and Wages | Compensation paid to employees |
| Interest Revenue | Income earned from interest-bearing accounts | Rent Expense | Cost of leasing office space or equipment |
| Rental Revenue | Income from renting out property | Marketing and Advertising | Costs associated with promoting products or services |
Gathering Necessary Financial Data: How To Prepare A Profit And Loss Statement
Preparing a comprehensive and accurate Profit and Loss (P&L) statement hinges on the meticulous collection and organization of relevant financial data. This section details the sources of this data, effective collection methods, and the crucial role of accuracy and timeliness in ensuring a reliable P&L.
The accuracy of your P&L statement is directly proportional to the accuracy of your source data. Inaccurate or incomplete data will lead to misleading financial insights, potentially impacting crucial business decisions. Therefore, a robust data collection process is paramount.
Sources of Financial Data for a P&L Statement
To create a complete P&L statement, you need to gather financial information from various internal sources. These sources provide the raw data necessary to calculate revenues, costs of goods sold, operating expenses, and ultimately, your net profit or loss. Missing data from any of these sources will result in an incomplete or inaccurate P&L.
- Sales Records: Invoices, receipts, and point-of-sale (POS) system data detailing all sales transactions. This includes information on the quantity sold, unit price, and total revenue generated.
- Purchase Records: Invoices, purchase orders, and receipts documenting all purchases of goods or services used in the production or delivery of goods/services. This is crucial for calculating the cost of goods sold.
- Inventory Records: Data on beginning and ending inventory levels, as well as any adjustments made during the period. This information is critical for accurate cost of goods sold calculations using methods such as FIFO (First-In, First-Out) or LIFO (Last-In, First-Out).
- Payroll Records: Data on employee salaries, wages, bonuses, and payroll taxes. This comprises a significant portion of operating expenses.
- Expense Records: Receipts, bank statements, and accounting software data detailing all operating expenses, including rent, utilities, marketing, and administrative costs.
- Financial Statements from Previous Periods: These provide a baseline for comparison and trend analysis, allowing for identification of changes in revenue and expense patterns.
Methods for Collecting and Organizing Financial Records
Effective data collection involves establishing a structured system for recording and organizing financial information. This ensures data integrity and facilitates the efficient preparation of the P&L statement. A systematic approach minimizes errors and saves time in the long run.
- Accounting Software: Utilizing accounting software such as QuickBooks, Xero, or Zoho Books automates many aspects of data collection and organization. These programs offer features for tracking sales, expenses, and inventory, and generate reports including P&L statements automatically.
- Spreadsheet Software: Spreadsheets like Microsoft Excel or Google Sheets can be used to manually record and organize financial data. This requires more manual effort but allows for greater customization. However, error-checking and formula validation are crucial.
- Dedicated Accounting Personnel: Employing an accountant or bookkeeper ensures accurate and timely data recording and processing. This is particularly beneficial for businesses with complex financial operations.
- Regular Data Backup: Regularly backing up financial data protects against data loss due to hardware failure or other unforeseen circumstances.
Importance of Accurate and Timely Data Collection
The accuracy and timeliness of data collection are paramount for generating a reliable P&L statement. Delays or inaccuracies can lead to flawed financial analysis and poor decision-making.
Accurate and timely data collection is the cornerstone of sound financial management.
Delayed data collection can hinder timely financial reporting, making it difficult to identify and address financial issues promptly. Inaccurate data can lead to misinterpretations of financial performance, potentially resulting in incorrect strategic decisions. For example, an overestimation of revenue or an underestimation of expenses could lead to unrealistic financial projections and ultimately, business failure. Conversely, a small bakery might miscalculate their ingredient costs, leading to an inaccurate profit margin and an inability to price their goods competitively.
Calculating Key Metrics
Calculating key metrics from your financial data is crucial for understanding your business’s profitability. These metrics provide a clear picture of your financial health and help you make informed decisions. We’ll focus on two primary metrics: Gross Profit and Net Profit, along with the calculation of operating expenses.
Gross Profit Calculation and Significance
Gross profit represents the profit a business makes after deducting the direct costs associated with producing its goods or services. It provides a measure of profitability before considering operating expenses like rent, salaries, and marketing. The formula for calculating gross profit is straightforward:
Gross Profit = Revenue – Cost of Goods Sold (COGS)
The significance of gross profit lies in its ability to reveal the efficiency of your production or service delivery. A high gross profit margin (Gross Profit / Revenue) indicates efficient operations and strong pricing strategies. Conversely, a low gross profit margin may signal the need for cost reduction strategies or price adjustments. For example, a bakery with revenue of $10,000 and COGS of $4,000 has a gross profit of $6,000.
Net Profit Calculation and Interpretation
Net profit, also known as net income, is the ultimate measure of a business’s profitability. It represents the profit remaining after all expenses, including both direct and indirect costs, have been deducted from revenue. The calculation is:
Net Profit = Revenue – Cost of Goods Sold (COGS) – Operating Expenses
Net profit is a crucial indicator of a company’s financial health and its ability to generate returns for its owners or investors. A high net profit margin (Net Profit / Revenue) suggests strong financial performance and sustainable growth potential. Conversely, a low or negative net profit margin warrants a thorough review of cost management and revenue generation strategies. For instance, if the bakery from the previous example has operating expenses of $3,000, its net profit is $3,000 ($6,000 – $3,000).
Operating Expenses Calculation
Operating expenses encompass all costs incurred in running a business, excluding the direct costs of producing goods or services (COGS). These can be categorized and calculated individually. Examples include:
- Rent Expense: The monthly or annual cost of leasing business premises.
- Salaries Expense: The total wages and salaries paid to employees.
- Utilities Expense: Costs associated with electricity, water, gas, and internet services.
- Marketing and Advertising Expense: Costs incurred on promotional activities.
- Insurance Expense: Premiums paid for various business insurance policies.
- Depreciation Expense: The allocation of the cost of assets over their useful life.
Calculating each expense involves gathering relevant invoices, receipts, and payroll records. Total operating expenses are then determined by summing up all individual expense categories.
Step-by-Step Net Profit Calculation
Let’s illustrate a step-by-step calculation of net profit using sample data for a fictional small business, “Acme Widgets”:
| Item | Amount ($) |
|---|---|
| Revenue | 50,000 |
| Cost of Goods Sold (COGS) | 20,000 |
| Rent Expense | 5,000 |
| Salaries Expense | 10,000 |
| Utilities Expense | 1,000 |
| Marketing Expense | 2,000 |
| Insurance Expense | 1,000 |
| Depreciation Expense | 1,000 |
Step 1: Calculate Gross Profit
Gross Profit = Revenue – COGS = $50,000 – $20,000 = $30,000
Step 2: Calculate Total Operating Expenses
Total Operating Expenses = $5,000 + $10,000 + $1,000 + $2,000 + $1,000 + $1,000 = $20,000
Step 3: Calculate Net Profit
Net Profit = Gross Profit – Total Operating Expenses = $30,000 – $20,000 = $10,000
Therefore, Acme Widgets has a net profit of $10,000.
Formatting and Presenting the P&L Statement
A well-formatted profit and loss statement (P&L) is crucial for clear communication of a company’s financial performance. A visually appealing and easily understandable P&L allows stakeholders, from investors to management, to quickly grasp key financial information and make informed decisions. The format should be consistent and follow generally accepted accounting principles (GAAP) or International Financial Reporting Standards (IFRS), depending on the jurisdiction.
The importance of clear and concise presentation cannot be overstated. A cluttered or ambiguous P&L can lead to misinterpretations and poor decision-making. Simplicity and clarity are key; the statement should be easily navigable and provide a straightforward overview of revenue, expenses, and resulting profit or loss. Using appropriate headings, subheadings, and clear labeling of accounts enhances readability and comprehension significantly. Furthermore, consistent formatting across different reporting periods allows for easy comparison and trend analysis.
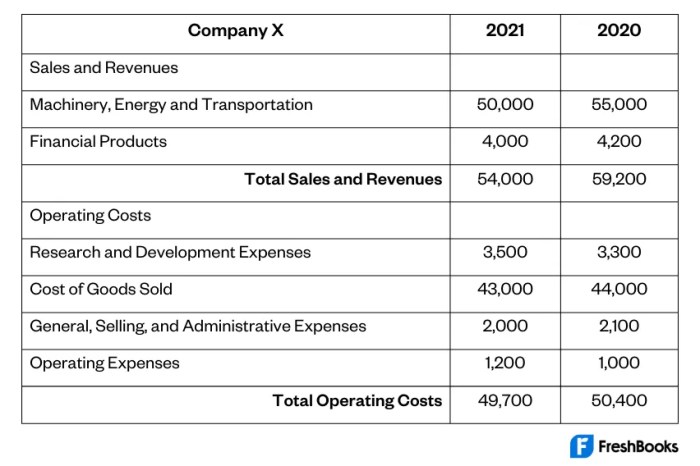
Standard P&L Statement Format
The standard format typically presents information in a vertical structure, categorizing accounts into revenue, cost of goods sold (COGS), gross profit, operating expenses, and net profit or loss. Revenue is listed first, followed by deductions to arrive at net profit or loss. Sub-categories within each main category provide further detail. For example, operating expenses might be broken down into selling, general, and administrative expenses. The use of clear and concise labels for each account is essential for accurate interpretation. The statement often includes a comparison period (e.g., the same period from the previous year) to highlight trends and performance changes.
Example P&L Statement
The following example illustrates a basic P&L statement using an HTML table. Note that this is a simplified example and real-world P&L statements may include far more detailed line items.
| Account Name | Debit | Credit | Balance |
|---|---|---|---|
| Revenue | 100,000 | 100,000 | |
| Cost of Goods Sold | 40,000 | -40,000 | |
| Gross Profit | 60,000 | ||
| Operating Expenses | 20,000 | -20,000 | |
| Selling Expenses | 10,000 | -10,000 | |
| Administrative Expenses | 10,000 | -10,000 | |
| Net Profit | 40,000 |
Analyzing the Results
A well-prepared Profit and Loss (P&L) statement is more than just a record of financial transactions; it’s a powerful tool for understanding your business’s financial health and identifying areas for improvement. Analyzing the key figures within the P&L allows you to make data-driven decisions, ultimately leading to increased profitability and sustainable growth. This section will guide you through interpreting the P&L’s key metrics and using that information for strategic decision-making.
Interpreting Key Figures on the P&L Statement
The P&L statement presents a clear picture of your revenue, expenses, and resulting profit or loss over a specific period. Key figures to focus on include revenue, cost of goods sold (COGS), gross profit, operating expenses, operating income, and net income. Analyzing the trends in these figures over time provides valuable insights into your business’s performance. For example, a consistent increase in revenue coupled with a stable or decreasing COGS indicates improved profitability. Conversely, a decline in revenue or a significant increase in operating expenses can signal potential problems that require immediate attention. Understanding the relationship between these figures is crucial for a comprehensive analysis.
Identifying Areas for Improvement
Analyzing the P&L statement often reveals areas ripe for improvement. For instance, a high COGS percentage compared to revenue might indicate inefficiencies in production or sourcing. This could necessitate a review of supplier contracts, exploring alternative materials, or streamlining production processes. Similarly, unusually high operating expenses warrant a detailed investigation. This might involve identifying areas where costs can be reduced without compromising quality or service. Perhaps marketing campaigns aren’t yielding sufficient returns, or administrative overhead is excessive. A thorough analysis can pinpoint these weaknesses, allowing for targeted improvements. For example, a company with consistently high marketing costs relative to sales might consider shifting to more cost-effective strategies like content marketing or search engine optimization.
Using the P&L for Business Decision-Making
The P&L statement serves as a cornerstone for various business decisions. It informs strategic planning, allowing businesses to set realistic goals and allocate resources effectively. For example, a consistently profitable P&L might justify expansion plans, while a recurring loss might necessitate a strategic restructuring or pivot. Furthermore, the P&L is essential for securing financing. Lenders and investors rely heavily on the P&L to assess the financial health and viability of a business before extending credit or investing capital. A strong and consistently improving P&L significantly enhances a company’s creditworthiness and attractiveness to investors.
Examples of Insightful P&L Analysis
Consider a small bakery whose P&L consistently shows high ingredient costs. Analyzing this data might reveal that sourcing ingredients from a cheaper supplier, without compromising quality, could significantly improve the gross profit margin. Alternatively, a restaurant experiencing declining revenue could use its P&L to identify whether the issue stems from reduced customer traffic, lower average order value, or a combination of both. This analysis can inform marketing strategies, menu adjustments, or service improvements to reverse the trend. A technology company consistently showing high research and development costs but low sales might need to re-evaluate its product development strategy, potentially focusing on products with higher market demand. The P&L provides the data needed to make informed decisions in all these scenarios.
Illustrative Examples

Understanding how a profit and loss statement works is best achieved through practical examples. The following scenarios illustrate the application of P&L statement creation for different business types and highlight key performance indicators.
Example 1: A Small Retail Business
Let’s consider “Cozy Candles,” a small business selling handcrafted candles. During the month of October, Cozy Candles generated $5,000 in revenue from candle sales. Their expenses included $1,000 in materials (wax, wicks, fragrances), $500 in rent, $200 in utilities, $300 in marketing (online advertising), and $100 in miscellaneous expenses. The resulting profit and loss statement would look like this:
| Revenue | Amount ($) |
|---|---|
| Candle Sales | 5000 |
| Total Revenue | 5000 |
| Expenses | Amount ($) |
| Materials | 1000 |
| Rent | 500 |
| Utilities | 200 |
| Marketing | 300 |
| Miscellaneous | 100 |
| Total Expenses | 2100 |
| Net Profit | 2900 |
Cozy Candles shows a healthy net profit of $2900 for October, indicating successful operations and strong demand for their products.
Example 2: A Service-Based Business
“Tech Solutions,” a small IT consulting firm, provides website design and technical support services. In November, they billed clients $12,000 for website design and $8,000 for technical support. Their expenses included $3,000 in salaries, $1,000 in office rent, $500 in software subscriptions, $1,500 in marketing and advertising, and $500 in travel expenses. The P&L statement is presented below:
| Revenue | Amount ($) |
|---|---|
| Website Design | 12000 |
| Technical Support | 8000 |
| Total Revenue | 20000 |
| Expenses | Amount ($) |
| Salaries | 3000 |
| Rent | 1000 |
| Software Subscriptions | 500 |
| Marketing & Advertising | 1500 |
| Travel | 500 |
| Total Expenses | 6500 |
| Net Profit | 13500 |
Tech Solutions demonstrates a significantly higher net profit than Cozy Candles, reflecting the higher revenue generated from their services and potentially a lower cost structure relative to their revenue.
Example 3: Comparative Analysis of Two Businesses
Let’s compare Cozy Candles and Tech Solutions to highlight differences in their financial performance.
The following bullet points compare and contrast the profit and loss statements of Cozy Candles and Tech Solutions:
- Revenue: Tech Solutions generated significantly higher revenue ($20,000) compared to Cozy Candles ($5,000), reflecting the difference in service offerings and pricing strategies.
- Expenses: Tech Solutions had higher overall expenses ($6,500) than Cozy Candles ($2,100), primarily due to higher salary costs associated with its service-based model.
- Profitability: Despite higher expenses, Tech Solutions achieved a much higher net profit ($13,500) than Cozy Candles ($2,900), indicating greater profitability and efficiency in its operations.
- Profit Margin: Tech Solutions has a higher profit margin (calculated as Net Profit / Revenue) than Cozy Candles, showing a greater percentage of revenue retained as profit. This could indicate superior pricing strategies or more efficient cost management.
Epilogue

Mastering the art of preparing a profit and loss statement empowers you to gain a deep understanding of your business’s financial performance. By accurately tracking revenue and expenses, you can identify areas for improvement, optimize profitability, and make data-driven decisions that will propel your business towards success. This guide has provided a comprehensive framework; remember that consistent monitoring and analysis of your P&L statement are key to maintaining a healthy financial outlook. Regularly review your figures, and don’t hesitate to seek professional advice if needed to further refine your financial strategies.
FAQ Overview
What if I have multiple revenue streams? How do I represent them on the P&L?
Categorize each revenue stream separately on your P&L statement. This allows for a clearer understanding of the contribution of each source to your overall revenue.
How often should I prepare a P&L statement?
The frequency depends on your business needs. Monthly P&L statements are generally recommended for close monitoring, while quarterly or annual statements might suffice for some businesses.
What accounting software can help me prepare a P&L statement?
Many accounting software options exist, such as QuickBooks, Xero, and FreshBooks, that automate much of the process and provide helpful reporting features.
Can I use a P&L statement to secure a loan?
Yes, a well-prepared P&L statement is a crucial document lenders review to assess your business’s financial health and creditworthiness.
Explore the different advantages of How to Streamline Financial Reporting for Efficiency that can change the way you view this issue.