


Cost Control Strategies Using Accounting Data are crucial for business success. Effective cost management, deeply intertwined with accurate accounting data analysis, allows businesses to optimize resource allocation, enhance profitability, and maintain a competitive edge. Understanding key cost drivers, implementing robust budgeting and forecasting techniques, and employing efficient inventory management strategies are all integral components of a comprehensive cost control plan. Failure to control costs can lead to reduced profits, cash flow problems, and even business failure.
This exploration delves into the multifaceted world of cost control, examining various strategies and techniques that leverage accounting data for informed decision-making. We will analyze different cost analysis methods, explore inventory management approaches, and discuss cost reduction strategies, ultimately demonstrating how effective cost control contributes significantly to overall business performance and long-term sustainability.
Introduction to Cost Control: Cost Control Strategies Using Accounting Data
Effective cost control is paramount for the financial health and long-term sustainability of any business, regardless of size or industry. Without a robust cost control system, businesses risk operational inefficiencies, reduced profitability, and even potential failure. Understanding and implementing effective cost control strategies are crucial for maximizing profits and achieving business objectives.
Cost control involves the systematic monitoring, analysis, and management of business expenses to ensure they align with the organization’s strategic goals and budgetary constraints. It’s inextricably linked to accounting data, as accurate and timely financial information provides the foundation for identifying cost trends, pinpointing areas of inefficiency, and making informed decisions about resource allocation. Essentially, accounting data provides the raw material for effective cost control.
Negative Consequences of Poor Cost Control
Poor cost control can lead to a cascade of negative consequences, significantly impacting a business’s bottom line and overall performance. For example, uncontrolled spending can deplete cash reserves, hindering a company’s ability to invest in growth opportunities or weather economic downturns. In addition, inefficient processes and unnecessary expenses can erode profit margins, reducing the overall return on investment. A lack of cost awareness can also lead to missed opportunities for innovation and improvement, as resources are not optimally allocated to high-impact areas. Furthermore, poor cost control can damage investor confidence and negatively impact the company’s credit rating, making it more difficult to secure financing in the future. Consider a hypothetical scenario where a manufacturing company fails to monitor its raw material costs. A gradual increase in raw material prices, left unchecked, could dramatically increase production costs, leading to lower profit margins and potentially even losses. The timely identification of this cost increase through effective cost control measures, on the other hand, would allow the company to explore alternative suppliers, renegotiate contracts, or adjust pricing strategies to mitigate the negative impact.
Analyzing Key Cost Drivers
Understanding and managing key cost drivers is crucial for any manufacturing business aiming for profitability. By identifying the factors that significantly impact costs, businesses can implement targeted strategies to improve efficiency and reduce expenses. This section will explore the identification, analysis, and mitigation of key cost drivers within a hypothetical manufacturing context.
Effective cost control requires a systematic approach to identifying and analyzing the factors driving expenses. This involves examining both direct and indirect costs, understanding their relationships, and using appropriate analytical techniques to pinpoint areas for improvement.
Identifying Primary Cost Drivers in a Hypothetical Manufacturing Business
Let’s consider a hypothetical furniture manufacturing business. The following table Artikels some key cost drivers, their descriptions, their impact on profit, and potential mitigation strategies.
| Cost Driver | Description | Impact on Profit | Mitigation Strategy |
|---|---|---|---|
| Raw Material Costs | The cost of wood, fabrics, hardware, and other materials used in furniture production. | Directly impacts profitability; higher material costs reduce profit margins. | Negotiate better pricing with suppliers, explore alternative, less expensive materials (without compromising quality), implement inventory management systems to minimize waste and spoilage. |
| Labor Costs | Wages and benefits paid to production workers, assembly line staff, and other employees involved in manufacturing. | Significant impact; higher labor costs reduce profitability. | Optimize production processes to improve efficiency, invest in automation to reduce reliance on manual labor, offer training programs to improve worker productivity. |
| Energy Costs | Electricity, gas, and other energy consumed during the manufacturing process. | Can significantly impact costs, especially for energy-intensive processes. | Invest in energy-efficient equipment, improve insulation in the manufacturing facility, explore renewable energy sources. |
| Machine Maintenance and Repair | Costs associated with maintaining and repairing production machinery. | Indirectly impacts profitability through downtime and reduced production. | Implement a preventative maintenance program, invest in high-quality machinery with longer lifespans, train maintenance personnel effectively. |
Methods for Collecting and Analyzing Cost Data
Accurate cost data is essential for effective cost driver analysis. This data is primarily collected from accounting records, which include various sources such as purchase orders, invoices, payroll records, and production reports. Data collection methods often involve using Enterprise Resource Planning (ERP) systems to integrate and track data from different departments. Data is then analyzed using various techniques.
Comparing and Contrasting Cost Driver Analysis Methods
Several methods exist for analyzing cost drivers, each with its strengths and weaknesses. Two common approaches are variance analysis and trend analysis.
Variance Analysis compares actual costs to budgeted or standard costs. This highlights deviations and helps identify areas where costs are exceeding expectations. For example, a significant unfavorable variance in raw material costs might indicate a need to renegotiate supplier contracts or explore alternative materials. Variance analysis helps pinpoint specific areas of concern and provides a quantifiable measure of cost performance.
Trend Analysis examines cost data over time to identify patterns and trends. This can reveal underlying issues not immediately apparent through a single-period analysis. For example, a consistently increasing trend in energy costs might suggest the need for long-term investments in energy efficiency. Trend analysis provides a broader perspective on cost behavior and helps predict future costs.
While both methods are valuable, they provide different insights. Variance analysis offers a snapshot of current cost performance, while trend analysis provides a longitudinal view, revealing long-term patterns and potential future challenges. Ideally, both methods should be used in conjunction to gain a comprehensive understanding of cost drivers.
Budgeting and Forecasting Techniques
Effective budgeting and forecasting are crucial for maintaining cost control within any business. These processes allow businesses to proactively manage expenses, allocate resources efficiently, and ultimately, improve profitability. By accurately predicting future costs, businesses can make informed decisions about pricing, investment, and operational strategies.
Budgeting involves creating a detailed plan of expected income and expenses over a specific period, typically a year. Forecasting, on the other hand, uses historical data and market trends to predict future financial performance. Both are interconnected and vital tools for cost control.
Sample Budget for a Small Retail Business
This example illustrates a simplified annual budget for a small retail clothing store. It’s important to note that real-world budgets would be far more detailed and nuanced, incorporating seasonal variations and specific product lines.
| Category | January | February | March | April | May | June | July | August | September | October | November | December | Total |
|---|---|---|---|---|---|---|---|---|---|---|---|---|---|
| Sales Revenue | $5,000 | $6,000 | $7,000 | $8,000 | $9,000 | $10,000 | $9,000 | $8,000 | $7,000 | $8,000 | $10,000 | $12,000 | $97,000 |
| Cost of Goods Sold | $2,500 | $3,000 | $3,500 | $4,000 | $4,500 | $5,000 | $4,500 | $4,000 | $3,500 | $4,000 | $5,000 | $6,000 | $48,000 |
| Rent | $500 | $500 | $500 | $500 | $500 | $500 | $500 | $500 | $500 | $500 | $500 | $500 | $6,000 |
| Salaries | $1,000 | $1,000 | $1,000 | $1,000 | $1,000 | $1,000 | $1,000 | $1,000 | $1,000 | $1,000 | $1,000 | $1,000 | $12,000 |
| Utilities | $100 | $100 | $100 | $100 | $100 | $100 | $100 | $100 | $100 | $100 | $100 | $100 | $1,200 |
| Marketing | $200 | $200 | $200 | $200 | $200 | $200 | $200 | $200 | $200 | $200 | $200 | $200 | $2,400 |
| Net Profit | $1,700 | $1,800 | $2,300 | $2,800 | $3,300 | $3,800 | $3,300 | $2,800 | $2,300 | $2,800 | $3,800 | $4,800 | $36,000 |
Forecasting Model for Future Costs
A simple forecasting model could utilize linear regression, analyzing historical data to predict future costs. For example, if the cost of utilities has increased by an average of 5% annually over the past five years, a simple linear projection can estimate future utility costs. More sophisticated models might incorporate seasonal factors or external economic indicators.
For instance, if the average monthly utility cost over the last five years was $100, and increased by 5% annually, a simple linear projection for the next year would be approximately $105 in the first month, $110.25 in the second, and so on. This projection assumes a consistent rate of increase, which may not always hold true.
Regular Budget Reviews and Adjustments
Regular budget reviews, ideally monthly, are essential for effective cost control. These reviews allow for comparison of actual performance against the budget, highlighting variances and identifying potential issues. Adjustments to the budget might be necessary to reflect changing market conditions, unexpected expenses, or improved sales performance. For example, if sales are consistently exceeding projections, the budget may be adjusted to allocate more resources to marketing or inventory. Conversely, if sales fall short of expectations, adjustments may include reducing marketing expenses or negotiating lower prices with suppliers.
Inventory Management Strategies
Effective inventory management is crucial for cost control. Holding excessive inventory ties up capital, increases storage costs, and risks obsolescence, directly impacting a company’s profitability. Conversely, insufficient inventory can lead to lost sales and dissatisfied customers. Understanding and implementing appropriate inventory management strategies is therefore vital for maintaining a healthy balance between supply and demand.
Impact of Inventory Holding Costs on Profitability
Inventory holding costs encompass a range of expenses associated with storing and maintaining inventory. These costs include storage fees (rent, utilities, security), insurance, taxes, obsolescence, and the opportunity cost of capital tied up in inventory. High inventory holding costs directly reduce a company’s profit margins. For example, a company with high storage costs might see its profit margin decrease by 5% if its inventory levels are unnecessarily high, directly impacting the bottom line. The longer items remain in inventory, the greater the risk of damage, spoilage, or obsolescence, further eroding profitability. Efficient inventory management aims to minimize these costs by optimizing inventory levels.
Inventory Management Techniques and Their Cost Implications
Several techniques exist to manage inventory effectively. The choice of technique depends on factors such as the nature of the product, demand variability, and the cost of storage and ordering. Three commonly used methods are First-In, First-Out (FIFO), Last-In, First-Out (LIFO), and Just-In-Time (JIT).
Comparison of Inventory Management Techniques
| Technique | Description | Cost Implications |
|---|---|---|
| FIFO (First-In, First-Out) | Items are sold in the order they were received. Older inventory is sold first. | Lower risk of obsolescence; higher storage costs if demand is low; cost of goods sold reflects older prices, potentially impacting tax liability. |
| LIFO (Last-In, First-Out) | Items are sold in the reverse order they were received. Newer inventory is sold first. (Note: LIFO is less commonly used under IFRS.) | Higher risk of obsolescence for older inventory; lower storage costs if demand is high; cost of goods sold reflects current prices, potentially lowering tax liability in inflationary environments. |
| JIT (Just-In-Time) | Inventory is ordered and received only as needed to meet immediate demand. Minimal inventory is held. | Lower storage and obsolescence costs; higher risk of stockouts and production delays; requires accurate demand forecasting and strong supplier relationships. |
Cost Reduction Strategies
Effective cost reduction is crucial for the long-term profitability and sustainability of any service-based business. By strategically identifying areas for improvement and implementing targeted strategies, businesses can enhance their bottom line and allocate resources more efficiently. This section will explore several key strategies for achieving significant cost reductions.
Identifying Potential Areas for Cost Reduction in Service Businesses
Service businesses, unlike manufacturing, often have less tangible costs. However, significant savings can be found by analyzing operational and marketing expenditures. For example, a marketing agency might find substantial cost savings by optimizing its digital advertising campaigns, negotiating better rates with freelance designers, or streamlining its internal project management processes. Similarly, a consulting firm could reduce travel expenses through increased use of video conferencing, or a customer service company might reduce operational costs by implementing more efficient call routing systems. Careful examination of each department’s spending reveals opportunities for improvement.
Strategies for Negotiating Better Prices with Suppliers
Negotiating favorable supplier contracts is a powerful cost reduction tool. Building strong relationships with suppliers is key. This allows for open communication about pricing and volume discounts. Developing a detailed understanding of market prices for goods and services enables businesses to approach negotiations from a position of strength. Presenting a strong business case, outlining the volume of business you offer, and highlighting the long-term value of a partnership can significantly influence supplier willingness to negotiate. Furthermore, exploring alternative suppliers and creating a competitive bidding process can drive down costs. For example, a company could request multiple quotes for office supplies, allowing them to choose the most competitive offer.
Utilizing Technology for Cost Reduction
Technology offers numerous avenues for cost reduction in service businesses. Cloud-based software solutions, for instance, can replace expensive on-premise infrastructure, eliminating hardware maintenance and IT staff costs. Automation tools can streamline repetitive tasks, freeing up employees for higher-value activities. For example, a customer service department could implement a chatbot to handle routine inquiries, reducing the workload on human agents. Similarly, project management software can improve efficiency and reduce project overruns, while data analytics can identify areas of inefficiency and guide strategic decision-making. Investing in appropriate technology often leads to significant long-term cost savings.
Performance Measurement and Reporting
Effective cost control hinges on robust performance measurement and reporting. By regularly tracking key metrics and analyzing cost variances, businesses can identify areas for improvement and make data-driven decisions to optimize spending. This section Artikels strategies for designing a KPI dashboard, generating cost reports, and interpreting variance reports.
A well-designed system for performance measurement and reporting provides valuable insights into the effectiveness of cost control strategies. It allows for proactive identification of issues, facilitating timely intervention and preventing escalating costs.
KPI Dashboard Design for Cost Control
A key performance indicator (KPI) dashboard provides a centralized, visual representation of critical cost-related metrics. This allows management to quickly assess the overall health of cost control efforts and identify potential problem areas.
- Cost of Goods Sold (COGS) as a Percentage of Revenue: Tracks the efficiency of production and sales processes. A rising percentage may indicate inefficiencies requiring attention.
- Operating Expense Ratio: Compares operating expenses to revenue, highlighting areas where operational costs are disproportionately high.
- Inventory Turnover Rate: Measures how efficiently inventory is managed. Low turnover suggests potential issues with obsolete stock or poor demand forecasting.
- Purchase Price Variance: Compares actual purchase prices to budgeted or standard prices, highlighting potential savings or overspending opportunities with suppliers.
- Labor Cost Variance: Analyzes differences between actual labor costs and budgeted or standard labor costs, identifying areas of potential labor cost inefficiencies.
Generating Regular Cost Reports Using Accounting Data
Regular cost reports are crucial for monitoring performance and identifying trends. These reports leverage data from the general ledger, accounts payable, and inventory management systems.
For example, a monthly cost report might include a breakdown of direct and indirect costs, a comparison to budget, and key variances. This report could be generated using accounting software or spreadsheet programs, pulling data from various sources to create a comprehensive overview of costs.
Data visualization techniques, such as charts and graphs, can be incorporated to make the reports more easily digestible and to highlight key trends and variances. For instance, a line graph could visually represent the trend of COGS over time, while a bar chart could compare the actual costs of different departments against their budgets.
Interpreting Cost Variance Reports
Cost variance reports highlight the differences between planned (budgeted) costs and actual costs. Analyzing these variances is critical for identifying areas needing improvement.
For instance, a significant unfavorable variance in labor costs might indicate a need to review staffing levels, overtime policies, or training programs. Similarly, a large unfavorable variance in material costs could signal the need to renegotiate contracts with suppliers or explore alternative sourcing options. A thorough investigation into the root cause of each variance is essential to develop effective corrective actions. This often involves collaboration between accounting, operations, and other relevant departments.
Consider a scenario where a company budgeted $100,000 for marketing but spent $120,000. A variance analysis would reveal a $20,000 unfavorable variance. Further investigation might reveal that the increased spending was due to unexpected advertising costs or a successful but unplanned marketing campaign. Understanding the “why” behind the variance is crucial for informed decision-making.
Find out about how Best Payroll Software for Small Businesses in 2025 can deliver the best answers for your issues.
Case Study: Streamlining Operations at GreenThumb Landscaping
GreenThumb Landscaping, a mid-sized company specializing in residential lawn care, faced increasing pressure from rising fuel costs and labor expenses. Their existing cost management practices were rudimentary, leading to inconsistent profitability and difficulty in accurately forecasting future performance. To address these issues, they implemented a comprehensive cost control program guided by accounting data analysis.
Implementing Cost Control Measures at GreenThumb
GreenThumb began by meticulously tracking all expenses, categorizing them into direct and indirect costs. This involved implementing new software to monitor fuel consumption for each vehicle, labor hours per job, and material usage. Simultaneously, they conducted a thorough review of their existing contracts with suppliers, negotiating better rates for fertilizers and other consumables. The company also implemented a stricter maintenance schedule for their equipment, reducing repair costs and extending the lifespan of their assets.
Analyzing Key Cost Drivers and Identifying Areas for Improvement
Analysis of the collected data revealed that fuel costs and labor were the most significant contributors to overall expenses. Specifically, inefficient routing of service vehicles was identified as a major factor driving up fuel consumption. To address this, GreenThumb invested in route optimization software that significantly reduced travel distances and fuel usage. Furthermore, analysis of labor costs highlighted inconsistencies in job completion times. This led to the implementation of standardized work procedures and improved employee training, resulting in increased efficiency and reduced labor costs.
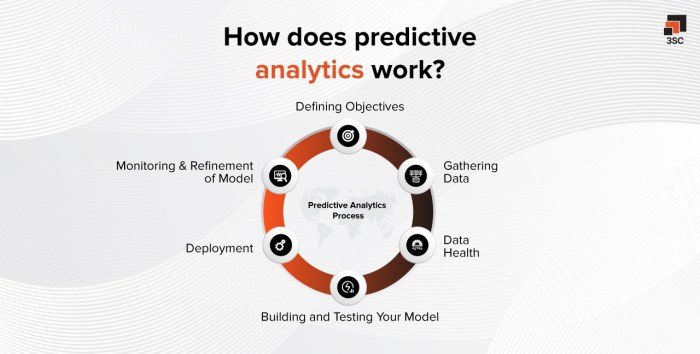
Budgeting and Forecasting Techniques: Predictive Modeling and Variance Analysis
Based on the improved data collection and analysis, GreenThumb developed a more accurate budgeting and forecasting system. They used historical data combined with predictive modeling to forecast future expenses and revenue. This allowed them to proactively adjust their pricing strategies and resource allocation based on anticipated market conditions. Regular variance analysis was implemented to monitor the differences between budgeted and actual results, enabling timely corrective actions. For example, if fertilizer costs exceeded the budget, they could renegotiate contracts or explore alternative suppliers.
Inventory Management Strategies: Just-in-Time and Optimized Stock Levels
GreenThumb implemented a just-in-time inventory management system for consumables like fertilizers and pesticides. This reduced storage costs and minimized the risk of spoilage or obsolescence. The company used sophisticated inventory management software to track stock levels and automatically generate purchase orders based on projected demand. This ensured that they had sufficient materials on hand without overstocking. The implementation of this system reduced inventory holding costs by approximately 15%.
Cost Reduction Strategies: Negotiated Pricing and Process Optimization
Negotiating better rates with suppliers resulted in significant savings on materials. Furthermore, process optimization, driven by data analysis, led to improvements in operational efficiency. For instance, streamlining the billing process reduced administrative overhead. The combination of these strategies led to a substantial reduction in overall operational costs.
Performance Measurement and Reporting: Key Performance Indicators (KPIs), Cost Control Strategies Using Accounting Data
GreenThumb established a comprehensive set of KPIs to track the effectiveness of their cost control measures. These KPIs included fuel consumption per job, labor costs per unit of service, inventory turnover rate, and overall profitability. Regular performance reports were generated and presented to management, allowing them to monitor progress and make data-driven decisions. This transparent reporting system ensured accountability and fostered a culture of cost consciousness throughout the organization.
Financial Outcomes
Within one year of implementing these cost control strategies, GreenThumb experienced a 20% reduction in overall operating costs. Their profitability increased by 15%, and their return on investment (ROI) improved significantly. The improved efficiency and accurate forecasting enabled them to secure additional contracts and expand their business operations.
Visual Representation of Cost Data
Effective visual representation of cost data is crucial for understanding trends, identifying areas for improvement, and communicating financial information clearly to various stakeholders. By transforming raw accounting data into easily digestible visuals, businesses can gain valuable insights and make data-driven decisions.
Visualizing cost trends over time allows for the quick identification of patterns and anomalies. For example, a line graph depicting monthly marketing expenses over a year could reveal seasonal fluctuations or unexpected spikes requiring investigation. This allows for proactive adjustments to budgets and strategies.
Line Graph Illustrating Cost Trends
A line graph is ideally suited for showing cost trends over time. Consider a scenario tracking the cost of raw materials for a manufacturing company over a 12-month period. The horizontal (x-axis) would represent the months (January to December), and the vertical (y-axis) would represent the cost of raw materials in dollars. Each data point would represent the cost for a specific month, connected by a line to illustrate the trend. A clear upward trend might indicate rising material prices, necessitating a review of sourcing strategies or negotiations with suppliers. A sudden dip could suggest a successful cost-saving initiative or a temporary market fluctuation. The title of the graph would be “Raw Material Costs (January-December)”, and a legend could be included to distinguish between different types of raw materials if multiple are being tracked. This visual representation quickly communicates the overall trend and allows for easy identification of significant changes or anomalies.
Comparative Analysis Using Bar Charts and Pie Charts
Different chart types effectively communicate cost data to various audiences.
Bar Chart for Comparative Analysis
Bar charts are effective for comparing costs across different categories within a specific time period. For example, a bar chart could compare the costs associated with different departments (e.g., marketing, sales, production) within a single quarter. Each bar would represent a department’s cost, allowing for immediate visual comparison of their relative expenses. The x-axis would list the departments, and the y-axis would represent the cost in dollars. This chart is easily understood by a wide range of stakeholders, including executive management, department heads, and investors.
Pie Chart for Proportional Representation
Pie charts are useful for showing the proportion of total costs attributed to different cost categories. For instance, a pie chart could illustrate the percentage of total operational costs allocated to rent, utilities, salaries, and marketing. Each slice of the pie represents a cost category, with its size proportional to its percentage of the total cost. This provides a quick overview of the cost structure and highlights the largest expense areas. This visual is particularly helpful for communicating cost composition to individuals less familiar with detailed financial data. For example, a pie chart could be used in a presentation to board members, giving them a high-level understanding of where the company’s money is being spent.
End of Discussion
Ultimately, mastering cost control strategies using accounting data is not merely about reducing expenses; it’s about optimizing resource utilization for maximum profitability and sustainable growth. By effectively analyzing cost drivers, implementing robust budgeting and forecasting techniques, and continuously monitoring performance, businesses can achieve a significant competitive advantage. The journey towards effective cost control is an ongoing process of refinement and adaptation, requiring consistent attention and strategic decision-making informed by accurate and insightful accounting data.
Frequently Asked Questions
What are some common pitfalls to avoid when implementing cost control strategies?
Common pitfalls include insufficient data analysis, unrealistic budgeting, neglecting non-financial factors, and lack of employee buy-in. Ignoring market trends and failing to adapt strategies to changing conditions are also critical errors.
How can technology assist in improving cost control?
Technology, such as ERP systems and data analytics tools, automates data collection, improves accuracy, and facilitates real-time monitoring of costs. These tools enable quicker identification of variances and allow for more proactive cost management.
How frequently should cost reports be generated and reviewed?
The frequency depends on the business and industry but ideally, regular reviews (monthly or quarterly) are necessary. More frequent reviews might be needed during periods of significant change or uncertainty.
What is the role of upper management in successful cost control implementation?
Upper management must champion the initiative, provide resources, and ensure accountability. Their commitment sets the tone and fosters a culture of cost consciousness throughout the organization.


