


How to Evaluate Financial Performance Using Accounting Metrics unveils the secrets behind understanding a company’s financial health. This journey explores key financial statements—the income statement, balance sheet, and cash flow statement—and delves into the insightful world of profitability, liquidity, solvency, and efficiency ratios. We’ll uncover how these metrics paint a comprehensive picture of a business’s past performance, present condition, and future potential, offering a robust framework for informed decision-making.
Through practical examples and clear explanations, we will demonstrate how to calculate and interpret various accounting ratios, enabling you to assess a company’s strengths and weaknesses. We will also address the limitations of solely relying on these metrics, emphasizing the importance of considering broader contextual factors for a complete financial evaluation. Prepare to gain a deeper understanding of how to effectively analyze financial performance and make data-driven judgments.
Introduction to Financial Statement Analysis

Understanding a company’s financial health is paramount for investors, creditors, and even internal management. This understanding is achieved primarily through the analysis of accounting metrics derived from financial statements. These metrics provide a quantitative assessment of a company’s performance, liquidity, and solvency, allowing for informed decision-making. Without a robust understanding of these metrics, crucial insights into profitability, efficiency, and risk are missed.
Analyzing financial statements allows stakeholders to assess the financial performance of a business objectively. By examining trends and comparing metrics across periods or against industry benchmarks, a comprehensive picture of a company’s financial standing emerges. This enables informed decisions regarding investments, loans, or strategic planning.
Key Financial Statements
Financial statement analysis centers around three core documents: the income statement, the balance sheet, and the cash flow statement. Each provides a different perspective on a company’s financial position.
The income statement, also known as the profit and loss (P&L) statement, summarizes a company’s revenues, expenses, and resulting profit or loss over a specific period. It shows how effectively a company generates revenue and manages its costs. Key metrics derived from the income statement include gross profit margin, operating profit margin, and net profit margin. For example, a consistently declining net profit margin might indicate rising costs or declining sales.
The balance sheet presents a snapshot of a company’s assets, liabilities, and equity at a specific point in time. It reveals the company’s financial structure and its ability to meet its short-term and long-term obligations. Important ratios derived from the balance sheet include the current ratio (current assets/current liabilities), indicating short-term liquidity, and the debt-to-equity ratio (total debt/total equity), reflecting the company’s financial leverage. A high debt-to-equity ratio, for example, suggests a higher risk of financial distress.
The cash flow statement tracks the movement of cash both into and out of a company over a period. It details cash flows from operating activities, investing activities, and financing activities. This statement is crucial because profitability (shown on the income statement) doesn’t always translate to cash in the bank. Analyzing cash flow helps understand a company’s ability to generate cash, pay its bills, and fund its operations and growth. A company might be profitable on paper but still experience cash flow problems.
Examples of Businesses Requiring Financial Statement Analysis
Financial statement analysis is not limited to large corporations; it’s vital across various business sizes and sectors.
For investors, analyzing financial statements is crucial before investing in a company, allowing them to assess its profitability, growth potential, and risk. For instance, an investor considering a stock purchase would examine the company’s historical financial performance to predict future returns.
Creditors, such as banks and lenders, use financial statement analysis to evaluate a borrower’s creditworthiness before extending loans. They assess the borrower’s ability to repay the loan based on its financial health and liquidity. A bank considering a loan application would carefully review the balance sheet and cash flow statement to gauge the applicant’s ability to service debt.
Internal management uses financial statement analysis for strategic planning and performance monitoring. They identify areas of strength and weakness, track progress towards goals, and make informed decisions about resource allocation. A company’s internal team might use financial statement analysis to evaluate the effectiveness of a new marketing campaign by analyzing sales figures and profitability metrics.
Profitability Ratios
Profitability ratios are crucial metrics used to assess a company’s ability to generate earnings from its operations. They provide insights into how efficiently a company manages its resources and converts sales into profits. Understanding these ratios is essential for investors, creditors, and management to evaluate the financial health and performance of a business. We will examine three key profitability ratios: gross profit margin, operating profit margin, and net profit margin.
Gross Profit Margin
The gross profit margin reveals the profitability of a company’s core business operations after deducting the direct costs of producing goods or services. A higher gross profit margin generally indicates greater efficiency in production and pricing strategies. It’s calculated as:
Gross Profit Margin = (Revenue – Cost of Goods Sold) / Revenue * 100%
For example, if a company has revenue of $1,000,000 and a cost of goods sold of $600,000, its gross profit margin is ($1,000,000 – $600,000) / $1,000,000 * 100% = 40%. A higher gross profit margin suggests the company is effectively managing its production costs or commanding premium prices. However, a high gross margin alone doesn’t guarantee overall profitability, as it doesn’t account for operating expenses.
Operating Profit Margin
The operating profit margin measures profitability after considering both direct and indirect operating expenses. It reflects the efficiency of a company’s operations in generating profit from its core business activities. The calculation is:
Operating Profit Margin = Operating Income / Revenue * 100%
Operating income is calculated as revenue minus the cost of goods sold and operating expenses (e.g., salaries, rent, utilities). Using the previous example, if operating income is $200,000, the operating profit margin is $200,000 / $1,000,000 * 100% = 20%. This indicates that 20% of the revenue remains after covering both direct and indirect operating costs. A higher operating profit margin suggests strong operational efficiency and effective cost control.
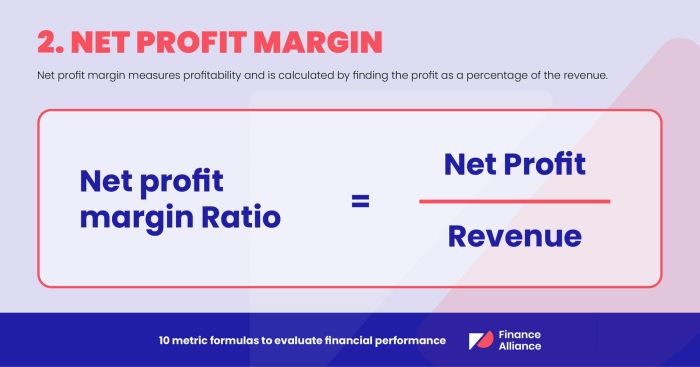
Net Profit Margin
The net profit margin represents the ultimate profitability of a company after all expenses, including interest, taxes, and other non-operating items, are deducted. It provides the clearest picture of a company’s overall profitability. It is calculated as:
Net Profit Margin = Net Income / Revenue * 100%
Continuing the example, if net income is $100,000, the net profit margin is $100,000 / $1,000,000 * 100% = 10%. This means that 10% of revenue translates into net profit after all expenses. This ratio is heavily influenced by various factors, including tax rates, interest expenses, and one-time gains or losses. A higher net profit margin generally signifies better overall financial health and performance.
Comparison of Profitability Ratios
The three ratios provide a comprehensive view of profitability, but each has its limitations. The gross profit margin focuses solely on the core business operations, ignoring operating expenses. The operating profit margin considers operating expenses but excludes non-operating items. The net profit margin offers the most comprehensive view, encompassing all expenses, but can be affected by factors outside the company’s direct control (like tax rates). Analyzing these ratios together provides a more nuanced understanding of a company’s financial performance.
Illustrative Example of Profitability Ratios
| Ratio | Formula | Example Data | Result |
|---|---|---|---|
| Gross Profit Margin | (Revenue – Cost of Goods Sold) / Revenue * 100% | Revenue: $1,000,000; Cost of Goods Sold: $600,000 | 40% |
| Operating Profit Margin | Operating Income / Revenue * 100% | Operating Income: $200,000; Revenue: $1,000,000 | 20% |
| Net Profit Margin | Net Income / Revenue * 100% | Net Income: $100,000; Revenue: $1,000,000 | 10% |
Liquidity Ratios
Liquidity ratios are crucial metrics used to assess a company’s ability to meet its short-term financial obligations. These ratios gauge the availability of liquid assets – readily convertible to cash – relative to current liabilities. A strong liquidity position indicates a company’s capacity to pay off its debts promptly, while a weak position can signal potential financial distress.
Current Ratio and Quick Ratio Calculations and Significance
The current ratio and quick ratio are two fundamental liquidity ratios. The current ratio is calculated by dividing current assets by current liabilities:
Current Ratio = Current Assets / Current Liabilities
A higher current ratio generally suggests better short-term liquidity. For example, a company with a current ratio of 2.0 possesses twice the amount of current assets compared to its current liabilities. This indicates a healthy financial cushion. Conversely, a ratio below 1.0 implies that the company’s current liabilities exceed its current assets, raising concerns about its ability to meet immediate obligations.
The quick ratio, also known as the acid-test ratio, offers a more conservative assessment of liquidity. It excludes inventories and prepaid expenses from current assets, as these may not be easily converted into cash:
Quick Ratio = (Current Assets – Inventories – Prepaid Expenses) / Current Liabilities
The quick ratio provides a stricter measure of a company’s ability to meet its short-term debts using its most liquid assets. A company with a high quick ratio demonstrates a stronger capacity to pay off its immediate liabilities.
Factors Influencing Liquidity Ratios and Implications for Short-Term Financial Health
Several factors significantly influence a company’s liquidity ratios. These include sales growth, inventory management, credit policies, and the overall economic environment. Rapid sales growth can strain liquidity if the company cannot efficiently manage its working capital. Inefficient inventory management, leading to excessive inventory buildup, can reduce liquidity. Strict credit policies may improve liquidity by accelerating cash inflows but could also negatively impact sales volume. Economic downturns can significantly impact a company’s ability to collect receivables and may necessitate drawing down on available cash reserves, thus affecting liquidity ratios. A decline in liquidity ratios may signal a need for immediate action, such as securing additional financing or implementing cost-cutting measures to improve cash flow.
Limitations of Using Liquidity Ratios Alone for Evaluating Financial Performance
While liquidity ratios provide valuable insights into a company’s short-term financial health, relying solely on them for evaluating overall financial performance is unwise. It is essential to consider other financial metrics for a comprehensive assessment.
- Liquidity ratios do not provide insights into a company’s profitability or long-term solvency.
- The composition of current assets and liabilities is not considered in detail; for instance, a high current ratio may be misleading if a significant portion of current assets consists of slow-moving inventory.
- Industry-specific factors and seasonal variations can influence liquidity ratios, making comparisons across companies and time periods challenging.
- Manipulating accounting practices can artificially inflate liquidity ratios, obscuring the true financial health of a company.
- Liquidity ratios alone cannot predict future cash flows or the ability of a company to navigate unexpected financial challenges.
Solvency Ratios
Solvency ratios are crucial for assessing a company’s long-term financial health and its ability to meet its debt obligations. Unlike liquidity ratios which focus on short-term obligations, solvency ratios provide insights into a company’s capital structure and its capacity to withstand financial distress over an extended period. Analyzing these ratios helps investors and creditors understand the risk associated with lending to or investing in a particular company.
Three key solvency ratios provide a comprehensive view of a company’s financial stability: the debt-to-equity ratio, the times interest earned ratio, and the debt service coverage ratio. Each ratio offers a unique perspective on a company’s leverage and its ability to service its debt.
Debt-to-Equity Ratio
The debt-to-equity ratio measures the proportion of a company’s financing that comes from debt relative to equity. A higher ratio indicates greater reliance on debt financing, which can increase financial risk. Conversely, a lower ratio suggests a more conservative capital structure.
The formula for the debt-to-equity ratio is: Debt-to-Equity Ratio = Total Debt / Total Equity
For example, a company with $50 million in total debt and $100 million in total equity has a debt-to-equity ratio of 0.5 (50/100). This suggests a relatively moderate level of debt compared to equity. A ratio significantly above 1 indicates a high reliance on debt financing and potentially higher financial risk. Conversely, a ratio below 1 suggests a more conservative approach.
Times Interest Earned Ratio
The times interest earned (TIE) ratio indicates a company’s ability to meet its interest obligations from its operating income. A higher TIE ratio suggests a stronger ability to cover interest expenses, implying lower financial risk.
The formula for the times interest earned ratio is: Times Interest Earned Ratio = Earnings Before Interest and Taxes (EBIT) / Interest Expense
If a company has EBIT of $20 million and interest expense of $5 million, its TIE ratio is 4 (20/5). This indicates that the company’s operating income is four times its interest expense, suggesting a comfortable ability to service its debt. A TIE ratio below 1 indicates that the company’s operating income is insufficient to cover its interest payments, raising significant concerns about its ability to meet its debt obligations.
You also will receive the benefits of visiting Cash Flow Statement Explained for Beginners today.
Debt Service Coverage Ratio
The debt service coverage ratio (DSCR) is a more comprehensive measure of a company’s ability to meet all its debt obligations, including principal repayments and interest. It provides a broader picture of a company’s debt servicing capacity than the TIE ratio alone.
The formula for the debt service coverage ratio is: Debt Service Coverage Ratio = (Net Operating Income + Non-Cash Charges) / (Total Debt Service)
Net Operating Income represents earnings before interest, taxes, depreciation, and amortization (EBITDA). Non-cash charges include depreciation and amortization. Total debt service encompasses all interest and principal payments due during a specific period. A higher DSCR indicates a greater capacity to service debt obligations. For instance, a DSCR of 1.5 suggests that a company generates 1.5 times the amount needed to cover its debt service, providing a safety margin. A DSCR below 1 signifies that the company is struggling to meet its debt obligations.
Summary of Solvency Ratios
| Ratio | Formula | Interpretation |
|---|---|---|
| Debt-to-Equity Ratio | Total Debt / Total Equity | Higher ratio indicates higher reliance on debt financing and increased financial risk. |
| Times Interest Earned Ratio | EBIT / Interest Expense | Higher ratio suggests a stronger ability to cover interest expenses, implying lower financial risk. |
| Debt Service Coverage Ratio | (Net Operating Income + Non-Cash Charges) / Total Debt Service | Higher ratio indicates a greater capacity to service all debt obligations, including principal repayments. |
Efficiency Ratios
Efficiency ratios assess how effectively a company utilizes its assets to generate sales. They provide insights into operational efficiency and highlight areas for potential improvement. Understanding these ratios is crucial for evaluating a company’s ability to manage its resources and maximize profitability.
Inventory Turnover Ratio
The inventory turnover ratio measures how efficiently a company manages its inventory. A higher ratio generally indicates efficient inventory management, while a lower ratio may suggest overstocking or slow-moving inventory. The formula for calculating the inventory turnover ratio is:
Cost of Goods Sold / Average Inventory
Average inventory is calculated by adding the beginning and ending inventory for the period and dividing by two. For example, if Company A had a cost of goods sold of $500,000 and an average inventory of $100,000, its inventory turnover ratio would be 5 ($500,000 / $100,000). This suggests that Company A sells and replaces its inventory five times during the period. A lower ratio might indicate potential issues such as obsolete inventory or poor demand forecasting.
Accounts Receivable Turnover Ratio
The accounts receivable turnover ratio measures how efficiently a company collects payments from its customers. A higher ratio generally suggests effective credit and collection policies, while a lower ratio might indicate problems with collecting payments or overly lenient credit terms. The formula is:
Net Credit Sales / Average Accounts Receivable
Average accounts receivable is calculated similarly to average inventory. Let’s say Company B had net credit sales of $800,000 and average accounts receivable of $100,000. Its accounts receivable turnover ratio would be 8 ($800,000 / $100,000), indicating that Company B collects its receivables eight times during the period. A significantly lower ratio than industry averages might warrant investigation into credit policies and collection procedures.
Asset Turnover Ratio
The asset turnover ratio measures how efficiently a company uses its assets to generate sales. It provides a broad overview of operational efficiency by considering all assets. A higher ratio indicates better asset utilization. The formula is:
Net Sales / Average Total Assets
Average total assets are calculated by averaging the beginning and ending total assets for the period. If Company A (from the inventory turnover example) had net sales of $600,000 and average total assets of $200,000, its asset turnover ratio would be 3 ($600,000 / $200,000). This means that for every dollar of assets, Company A generated $3 in sales.
Comparative Analysis of Hypothetical Companies
Let’s compare Company A and Company B using the ratios calculated above. Company A shows an inventory turnover of 5 and an asset turnover of 3. Company B, with an accounts receivable turnover of 8, demonstrates strong efficiency in collecting payments. While we lack Company B’s inventory and asset turnover data for a complete comparison, the disparity in accounts receivable turnover already hints at differences in operational efficiency. Company B’s higher accounts receivable turnover suggests superior credit and collection management compared to Company A (assuming comparable credit policies). A comprehensive comparison requires data across all three ratios for both companies.
Improved Efficiency and Increased Profitability
Improvements in efficiency ratios can directly translate to increased profitability. For example, reducing inventory levels (improving inventory turnover) lowers storage costs and reduces the risk of obsolescence, increasing the profit margin. Similarly, faster collection of receivables (higher accounts receivable turnover) improves cash flow, allowing for better investment opportunities and reducing financing costs, thus boosting profitability. Efficient asset utilization (higher asset turnover) means generating more sales with fewer assets, leading to higher returns on investment. A company that effectively manages its inventory, receivables, and assets generally experiences improved profitability.
Analyzing Trends Over Time
Analyzing financial ratios over several periods is crucial for understanding a company’s performance trajectory and predicting future outcomes. A single year’s data can be misleading, influenced by external factors or temporary anomalies. Tracking trends reveals consistent patterns, indicating underlying strengths or weaknesses within the business model. This longitudinal perspective allows for more informed decision-making, whether for investors, creditors, or internal management.
Analyzing financial ratios over multiple periods provides a more comprehensive understanding of a company’s financial health than a snapshot in time. By examining trends, we can identify both positive developments and potential warning signs that might not be apparent from a single year’s data. This allows for more accurate predictions of future performance and facilitates better strategic planning.
Trend Analysis Illustrative Scenario
Let’s consider “Acme Corp,” a hypothetical manufacturing company. Over five years, their Return on Equity (ROE) showed a consistent upward trend, increasing from 10% in Year 1 to 18% in Year 5. This positive trend suggests effective management of assets and increasing profitability. However, if their Debt-to-Equity ratio also increased significantly during the same period, from 0.5 to 1.5, this would raise concerns about their financial leverage and increasing risk. The initially positive trend in ROE might be masking an unsustainable reliance on debt. This scenario highlights the importance of examining multiple ratios simultaneously to gain a holistic perspective. A single ratio, considered in isolation, may not tell the whole story.
Line Graph Depicting Return on Equity Trend, How to Evaluate Financial Performance Using Accounting Metrics
The line graph illustrates Acme Corp.’s Return on Equity (ROE) over five years. The horizontal axis represents the year (Year 1, Year 2, Year 3, Year 4, Year 5). The vertical axis represents the ROE, expressed as a percentage (0% to 20%). The data points would be plotted as follows: Year 1 (10%), Year 2 (12%), Year 3 (14%), Year 4 (16%), Year 5 (18%). The line connecting these points would show a clear upward trend, indicating improving profitability. However, a separate graph showing the Debt-to-Equity ratio would be necessary to assess the sustainability of this growth. A steep upward trend in the Debt-to-Equity ratio alongside the ROE would indicate increased risk, despite the improved profitability.
Benchmarking and Industry Comparisons
Comparing a company’s financial performance against its industry peers offers invaluable insights into its relative strengths and weaknesses. Benchmarking provides a context for interpreting a company’s financial ratios and identifying areas where it excels or lags behind competitors. This comparative analysis allows for a more nuanced understanding of the company’s financial health and potential for future growth.
Benchmarking allows for a more objective assessment of a company’s performance than simply looking at its own historical data. By comparing key financial metrics to industry averages or the performance of specific competitors, investors and analysts can better gauge a company’s efficiency, profitability, and risk profile. This comparative perspective is crucial for making informed investment decisions and for strategic planning within the company itself.
Benefits of Industry Comparisons
Comparing a company’s financial performance to its industry peers offers several key benefits. It facilitates a more accurate assessment of the company’s financial health by providing a contextual framework. This allows for identification of areas for improvement and highlights best practices within the industry. Furthermore, benchmarking helps in the setting of realistic financial goals and in the development of effective strategies for achieving competitive advantage.
Challenges in Benchmarking
Several challenges exist in effectively benchmarking a company’s financial performance. The selection of appropriate peer companies can be difficult, particularly in industries with diverse business models or varying levels of diversification. Differences in accounting methods and reporting practices can also distort comparisons. Finally, industry averages may not always be representative of a company’s specific circumstances or competitive position.
Overcoming Benchmarking Challenges
To overcome these challenges, a multi-faceted approach is necessary. Carefully selecting comparable companies based on size, business model, and geographic location is crucial. Adjusting for differences in accounting practices and using standardized financial metrics can minimize distortions. Analyzing individual company performance relative to the industry average, as well as the top performers within the industry, can provide a more complete picture.
Examples of Using Industry Averages
Consider a hypothetical company, “XYZ Corp,” operating in the retail clothing industry. If XYZ Corp’s profit margin is 5%, while the industry average is 8%, this suggests that XYZ Corp is less profitable than its peers. Further investigation might reveal inefficiencies in its supply chain, pricing strategies, or marketing efforts. Conversely, if XYZ Corp’s current ratio (a measure of liquidity) is significantly higher than the industry average, this might indicate a conservative financial strategy or perhaps an inefficient use of assets. By comparing its key ratios – such as return on assets (ROA), return on equity (ROE), and debt-to-equity ratio – to industry benchmarks, a comprehensive assessment of XYZ Corp’s relative financial strength can be made. This allows for targeted improvements in areas of weakness and a better understanding of the company’s overall financial health in relation to its competitive landscape.
Limitations of Accounting Metrics: How To Evaluate Financial Performance Using Accounting Metrics
While accounting metrics provide a valuable framework for evaluating financial performance, relying solely on them can be misleading. Their inherent limitations stem from the nature of accounting itself, which involves estimations, judgments, and adherence to specific accounting standards that may not fully capture the complexities of a business’s true financial health. A comprehensive assessment necessitates a broader perspective, incorporating qualitative factors and other analytical tools.
Accounting metrics are based on historical data, offering a rearview mirror perspective rather than a crystal ball for the future. They present a snapshot of the past, which may not accurately predict future performance. Furthermore, the reliance on historical cost accounting can undervalue assets, particularly in inflationary environments, leading to an underestimation of a company’s true net worth.
Impact of Accounting Choices and Estimations
The choice of accounting methods significantly influences reported financial figures. For example, different inventory valuation methods (FIFO, LIFO, weighted average) can lead to varying cost of goods sold and gross profit figures. Similarly, the depreciation method selected affects reported profits and asset values. These choices, while adhering to Generally Accepted Accounting Principles (GAAP) or International Financial Reporting Standards (IFRS), still introduce subjectivity and can be manipulated to present a more favorable (or less favorable) picture. Furthermore, estimations, such as the useful life of an asset for depreciation or the allowance for doubtful accounts, involve inherent uncertainty and can lead to significant variations in reported financial data. Consider a company choosing a shorter depreciation period for its equipment; this would lead to higher depreciation expense and lower reported profits in the short term, potentially affecting profitability ratios. Conversely, a longer depreciation period would have the opposite effect. These choices are not necessarily indicative of a company’s underlying financial strength or weakness.
Alternative Methods Complementing Accounting Metrics
Qualitative factors, often overlooked, provide crucial context for interpreting accounting metrics. These include factors such as management quality, employee morale, brand reputation, customer loyalty, and competitive landscape. For instance, a company with strong brand recognition and a loyal customer base might show higher profitability despite lower reported efficiency ratios, indicating strong intangible assets not fully reflected in the accounting figures. Other complementary methods include analyzing cash flow statements (providing a clearer picture of liquidity and solvency), conducting industry benchmarking (comparing performance to competitors), and evaluating market valuation (comparing market capitalization to book value). A thorough financial analysis should consider these qualitative and quantitative aspects for a comprehensive understanding of a company’s performance.
Final Summary
Mastering the art of financial statement analysis using accounting metrics empowers you to make informed decisions based on a solid understanding of a company’s financial position. By applying the techniques and insights discussed, you can confidently assess profitability, liquidity, solvency, and efficiency, ultimately gaining a clearer picture of a business’s overall health. Remember that while these metrics provide a valuable foundation, a holistic approach considering qualitative factors is crucial for a comprehensive evaluation. Use this knowledge to navigate the world of finance with increased confidence and accuracy.
Detailed FAQs
What are some common mistakes people make when interpreting financial ratios?
Common mistakes include focusing on single ratios in isolation, failing to consider industry benchmarks, and neglecting qualitative factors. A holistic approach considering multiple ratios and contextual information is crucial for accurate interpretation.
How frequently should financial ratios be analyzed?
Analyzing financial ratios should be done regularly, ideally quarterly or annually, to track trends and identify potential issues early. More frequent analysis might be necessary for companies experiencing rapid growth or facing significant challenges.
Can I use these techniques for personal finance as well?
While primarily designed for business analysis, many of the principles and concepts can be adapted for personal finance. Tracking your income, expenses, and net worth over time using similar ratio analysis can offer valuable insights into your personal financial health.