


Understanding Depreciation and Its Impact on Financial Statements sets the stage for a comprehensive exploration of how this crucial accounting concept shapes a company’s financial picture. Depreciation, the systematic allocation of an asset’s cost over its useful life, isn’t merely a bookkeeping entry; it significantly influences reported profits, asset values, and even tax liabilities. This analysis delves into various depreciation methods, their implications for income statements, balance sheets, and cash flow statements, ultimately providing a clear understanding of its role in financial statement analysis and decision-making.
We will examine the differences between depreciation, depletion, and amortization, exploring the nuances of straight-line, declining balance, and units of production methods. Through practical examples and calculations, we will illuminate how these methods impact net income, asset carrying amounts, and cash flow. Furthermore, we will discuss the crucial role depreciation plays in tax planning and capital budgeting decisions, equipping readers with the knowledge to interpret financial statements accurately and make informed business judgments.
Introduction to Depreciation
Depreciation is a crucial accounting concept that reflects the decline in the value of a tangible asset over its useful life. It’s not about the actual market value fluctuating; instead, it systematically allocates the cost of an asset over its estimated useful life, matching the expense with the revenue it generates. This process is essential for accurately reporting a company’s financial performance and position. Without depreciation, a company’s profits would be artificially inflated in the early years of an asset’s life and understated in later years, leading to a distorted picture of its financial health.
Depreciation ensures that the cost of an asset is expensed gradually over its useful life, providing a more accurate reflection of a company’s profitability and financial standing. This is a fundamental principle of the matching principle in accounting, which dictates that expenses should be recognized in the same period as the revenues they help generate. This prevents the misrepresentation of profits and provides a more realistic view of the company’s financial performance over time.
Types of Assets Subject to Depreciation
Many tangible assets used in business operations are subject to depreciation. These assets are typically long-term, meaning they have a useful life exceeding one year. The specific assets and their depreciation methods can vary significantly depending on industry, company policy, and regulatory requirements.
- Buildings: Office buildings, factories, warehouses, and other structures gradually lose value due to wear and tear, obsolescence, and the passage of time.
- Machinery and Equipment: Manufacturing equipment, computers, vehicles, and other tools used in production or operations depreciate as they age and become less efficient.
- Furniture and Fixtures: Office furniture, desks, chairs, and other similar items lose value over their useful life due to wear and tear.
- Vehicles: Cars, trucks, and other vehicles depreciate rapidly due to usage and technological advancements.
Depreciation, Depletion, and Amortization
While all three terms relate to the allocation of costs over time, they apply to different types of assets.
- Depreciation: Applies to tangible assets, such as buildings, machinery, and vehicles, that lose value over time due to wear and tear, obsolescence, or other factors.
- Depletion: Applies to natural resources, such as minerals, oil, and timber, that are consumed during extraction or use. It reflects the reduction in the quantity of the resource available.
- Amortization: Applies to intangible assets, such as patents, copyrights, and goodwill, that lose value over time due to factors such as expiry or obsolescence. It systematically spreads the cost of these assets over their useful lives.
The key difference lies in the nature of the asset being consumed or used up. Depreciation deals with physical assets, depletion with natural resources, and amortization with intangible assets. Each method ensures that the cost of these assets is properly allocated over their respective useful lives, providing a more accurate representation of a company’s financial performance.
Depreciation Methods
Depreciation, as we’ve established, is the systematic allocation of an asset’s cost over its useful life. However, several methods exist for calculating this allocation, each with its own implications for financial reporting. Understanding these different methods is crucial for accurate financial statement preparation and analysis. This section will explore three common depreciation methods: straight-line, declining balance, and units of production.
Straight-Line Depreciation
Straight-line depreciation is the simplest method. It evenly distributes the asset’s cost over its useful life. The formula is straightforward and easy to apply, making it a popular choice for many businesses. The annual depreciation expense remains constant throughout the asset’s life.
Annual Depreciation Expense = (Asset Cost – Salvage Value) / Useful Life
For example, consider a machine costing $10,000 with a salvage value of $1,000 and a useful life of 5 years. The annual depreciation expense would be ($10,000 – $1,000) / 5 = $1,800.
Declining Balance Depreciation
Unlike the straight-line method, the declining balance method accelerates depreciation. A fixed percentage of the asset’s *remaining* book value is depreciated each year. This results in higher depreciation expense in the early years of the asset’s life and lower expense in later years. A common rate used is double the straight-line rate.
Annual Depreciation Expense = (2 / Useful Life) * Book Value at Beginning of Year
Using the same machine example, with a double-declining balance rate (2/5 = 40%), the depreciation expense for the first year would be 0.40 * $10,000 = $4,000. The second year’s depreciation would be calculated on the remaining book value ($10,000 – $4,000 = $6,000), and so on.
Units of Production Depreciation
The units of production method ties depreciation expense directly to the asset’s actual use. Depreciation is calculated based on the number of units produced or the hours the asset is operated. This method is particularly suitable for assets whose useful life is more closely tied to usage rather than the passage of time.
Depreciation per Unit = (Asset Cost – Salvage Value) / Total Units to be Produced
Annual Depreciation Expense = Depreciation per Unit * Units Produced in the Year
Let’s assume the same machine is expected to produce 100,000 units over its life. The depreciation per unit would be ($10,000 – $1,000) / 100,000 = $0.09. If 20,000 units were produced in the first year, the depreciation expense would be $0.09 * 20,000 = $1,800.
Comparison of Depreciation Methods
The following table summarizes the advantages and disadvantages of each method:
| Method | Advantages | Disadvantages | Best Suited For |
|---|---|---|---|
| Straight-Line | Simple to calculate, consistent expense | Ignores the fact that assets may depreciate faster early in their life | Assets with relatively consistent usage over their life |
| Declining Balance | Reflects higher depreciation in early years, potentially matching higher revenue | Can lead to lower book value than salvage value; more complex calculations | Assets that depreciate more rapidly in early years |
| Units of Production | Directly relates depreciation to actual use, more accurate reflection of asset wear | Requires accurate prediction of total units produced, can be difficult to estimate | Assets whose useful life is directly related to production volume |
Impact on the Income Statement
Depreciation, while not a cash expense, significantly impacts a company’s income statement. It directly reduces reported net income, affecting various financial ratios and potentially influencing investor perceptions of the company’s profitability and financial health. Understanding this impact is crucial for accurate financial analysis.
Depreciation expense is subtracted from a company’s revenues to arrive at net income. This reduction reflects the allocation of an asset’s cost over its useful life, representing the portion of the asset’s value consumed during the accounting period. The higher the depreciation expense, the lower the reported net income. Conversely, lower depreciation expense leads to higher reported net income. This seemingly simple relationship has profound implications for financial reporting and decision-making.
Depreciation Methods and Net Income
Different depreciation methods result in varying depreciation expenses over an asset’s life. This directly impacts the reported net income each year. For example, consider a machine purchased for $100,000 with a useful life of 10 years and no salvage value.
Using the straight-line method, annual depreciation expense would be a consistent $10,000 ($100,000 / 10 years). This results in a predictable impact on net income each year. However, using the double-declining balance method, a higher depreciation expense is recorded in the early years of the asset’s life, leading to lower net income initially. In the later years, the depreciation expense is lower, resulting in higher net income. The total depreciation expense over the 10 years remains the same ($100,000) regardless of the method used, but the timing of the expense differs significantly. For instance, in year one, the double-declining balance method might yield a depreciation expense of $20,000, significantly impacting net income compared to the $10,000 under the straight-line method. This difference in depreciation expense, though ultimately offset over the asset’s lifespan, significantly influences year-to-year reported net income.
Depreciation and Profitability
The relationship between depreciation and profitability is not straightforward. While higher depreciation reduces reported net income, it doesn’t necessarily reflect a decline in the company’s actual profitability or operational efficiency. Depreciation is a non-cash expense, meaning it doesn’t involve an actual outflow of cash. Therefore, while it reduces net income, it doesn’t affect the company’s cash flow. Analyzing profitability should involve considering both net income and cash flow, allowing for a more comprehensive understanding of the company’s financial performance. Furthermore, different depreciation methods can significantly impact key profitability ratios such as Return on Assets (ROA) and Return on Equity (ROE), especially in the early years of an asset’s life. Investors and analysts must be aware of the depreciation method employed when interpreting these ratios. A company choosing an accelerated depreciation method might show lower net income initially, impacting short-term profitability ratios, but this doesn’t necessarily indicate a decline in the company’s long-term profitability or underlying business performance.
Impact on the Balance Sheet

Depreciation, while primarily impacting the income statement through depreciation expense, significantly affects the balance sheet by reducing the reported value of fixed assets. This reduction is reflected through an account called accumulated depreciation, which acts as a contra-asset account. Understanding this interaction is crucial for accurately assessing a company’s financial health and asset valuation.
Accumulated depreciation affects the carrying amount of assets by reducing their original cost. The carrying amount, also known as the net book value, represents the asset’s value on the balance sheet after accounting for accumulated depreciation. This figure is calculated by subtracting accumulated depreciation from the asset’s original cost. For example, if a machine was purchased for $100,000 and accumulated depreciation is $30,000, its carrying amount is $70,000. This lower carrying amount reflects the asset’s diminished value due to wear and tear or obsolescence.
Accumulated Depreciation Presentation on the Balance Sheet, Understanding Depreciation and Its Impact on Financial Statements
Accumulated depreciation is presented on the balance sheet as a deduction from the related asset’s cost. It’s not presented as a separate asset but rather as a contra-asset account. This means it’s listed directly below the asset’s cost on the balance sheet, reducing the overall value of the asset reported. For instance, under the Property, Plant, and Equipment (PP&E) section, you would see the gross cost of the asset, followed by accumulated depreciation, and then the net book value (carrying amount). This presentation provides a clear picture of the asset’s depreciated value.
Impact of Different Depreciation Methods on the Balance Sheet
Different depreciation methods, such as straight-line, declining balance, and units of production, result in varying levels of accumulated depreciation over the asset’s life. This directly impacts the carrying amount reported on the balance sheet. The straight-line method, which evenly distributes depreciation expense over the asset’s useful life, results in a consistent reduction in the carrying amount each year. In contrast, the declining balance method, an accelerated method, leads to higher depreciation expense and a faster reduction in the carrying amount during the early years of the asset’s life. The units of production method bases depreciation on actual usage, leading to fluctuations in the annual depreciation expense and therefore the carrying amount depending on the asset’s utilization.
For example, consider a machine with a $100,000 cost and a 10-year useful life. Using the straight-line method, annual depreciation would be $10,000, resulting in a consistent reduction of the carrying amount by $10,000 each year. However, using the double-declining balance method (an accelerated method), the depreciation expense would be higher in the initial years, leading to a faster decrease in the carrying amount on the balance sheet compared to the straight-line method. The impact on the balance sheet is therefore significantly different depending on the chosen depreciation method. This difference becomes more pronounced over the asset’s useful life. A company’s choice of depreciation method will therefore significantly affect the reported net book value of assets over time.
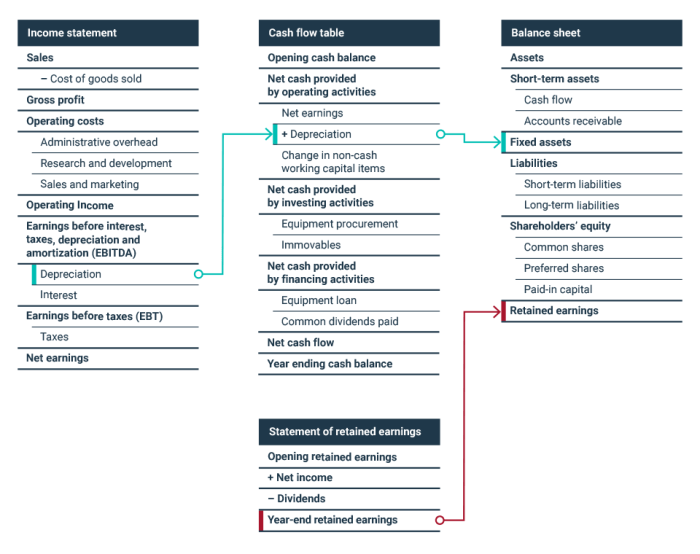
Impact on the Cash Flow Statement
Depreciation, while a non-cash expense, significantly influences a company’s cash flow statement, primarily through its impact on the calculation of cash flow from operating activities. Understanding this interaction is crucial for a complete picture of a company’s financial health.
Depreciation’s effect on the cash flow statement is indirect, primarily felt through its influence on net income, which is a key component in the indirect method of calculating cash flow from operating activities. Because depreciation reduces net income, it indirectly increases cash flow. This seemingly counterintuitive relationship stems from the fact that depreciation is a non-cash expense; it doesn’t represent an actual outflow of cash.
Depreciation’s Role in the Indirect Method
The indirect method starts with net income and adjusts it for non-cash items to arrive at cash flow from operating activities. Depreciation, being a non-cash expense, is added back to net income. This is because the deduction of depreciation reduced net income without a corresponding reduction in cash. Adding it back reverses this artificial reduction, providing a more accurate reflection of cash generated from operations.
Step-by-Step Illustration of Depreciation’s Impact
Let’s illustrate this with a simple example. Suppose a company reports net income of $100,000. Its depreciation expense for the period is $20,000. Using the indirect method:
1. Start with Net Income: $100,000
2. Add back Depreciation: + $20,000
3. Adjust for other non-cash items (if any): (This step might involve adding or subtracting other non-cash items like changes in working capital accounts.) For simplicity, we will assume no other adjustments are needed in this example.
4. Cash Flow from Operating Activities: $120,000
In this scenario, the cash flow from operating activities is $120,000, which is $20,000 higher than the net income. This difference directly reflects the non-cash nature of depreciation expense. The company’s actual cash flow from operations is higher because the depreciation expense reduced net income without requiring an actual cash outflow.
Why Depreciation Affects Cash Flow Despite Being Non-Cash
The key is that depreciation is an accounting expense designed to allocate the cost of an asset over its useful life. While it doesn’t involve a cash payment at the time of the expense recognition, the initial purchase of the asset *did* require a cash outflow. Depreciation simply spreads that initial cash outlay over several accounting periods. By adding back depreciation in the cash flow statement, we’re adjusting for this initial cash expenditure that’s already been accounted for. This gives a more accurate representation of the cash generated or used by the company’s operating activities.
Tax Implications of Depreciation: Understanding Depreciation And Its Impact On Financial Statements
Depreciation, while a non-cash expense, significantly impacts a company’s tax liability. Understanding how depreciation methods affect taxable income is crucial for effective tax planning and compliance. The Internal Revenue Service (IRS) provides guidelines on acceptable depreciation methods, and the choice of method can lead to substantial differences in tax payments over the asset’s lifespan.
Depreciation reduces taxable income by allowing businesses to deduct a portion of an asset’s cost each year over its useful life. This deduction lowers the company’s overall profit, thereby reducing the amount of income tax owed. The amount of this reduction directly correlates with the chosen depreciation method and the asset’s characteristics.
Depreciation Methods and Tax Liabilities
The choice of depreciation method directly influences the amount of depreciation expense recognized each year, and consequently, the taxable income. Different methods result in varying depreciation expense patterns over the asset’s life. For example, the straight-line method allocates equal depreciation expense each year, while accelerated methods, such as the double-declining balance method, allocate higher depreciation expense in the early years of an asset’s life and lower expense in later years.
Consider two companies, both purchasing identical machinery costing $100,000 with a 5-year useful life and no salvage value. Company A uses the straight-line method, while Company B uses the double-declining balance method. Assuming a 25% corporate tax rate:
| Year | Company A (Straight-Line) | Company B (Double-Declining Balance) |
|---|---|---|
| 1 | Depreciation: $20,000; Tax Savings: $5,000 | Depreciation: $40,000; Tax Savings: $10,000 |
| 2 | Depreciation: $20,000; Tax Savings: $5,000 | Depreciation: $24,000; Tax Savings: $6,000 |
| 3 | Depreciation: $20,000; Tax Savings: $5,000 | Depreciation: $14,400; Tax Savings: $3,600 |
| 4 | Depreciation: $20,000; Tax Savings: $5,000 | Depreciation: $8,640; Tax Savings: $2,160 |
| 5 | Depreciation: $20,000; Tax Savings: $5,000 | Depreciation: $8,640; Tax Savings: $2,160 |
| Total Tax Savings | $25,000 | $24,000 |
As shown, Company B, using the accelerated method, enjoys higher tax savings in the early years but lower savings in later years compared to Company A. The total tax savings over the five years differ slightly, illustrating the impact of method selection on the timing of tax benefits.
Choosing an Appropriate Depreciation Method for Tax Purposes
The selection of a depreciation method is a strategic decision with significant tax implications. Factors to consider include the asset’s nature, its expected useful life, and the company’s overall financial goals. While accelerated methods provide greater tax benefits upfront, they may result in lower tax savings in later years. The straight-line method offers a more consistent pattern of tax savings. Tax laws and regulations frequently change, making it essential to consult with tax professionals to determine the most appropriate method for a given situation and to ensure compliance. Choosing a method that aligns with the asset’s actual depreciation pattern and minimizes overall tax liability is paramount. Furthermore, it’s important to consider the potential interaction between depreciation and other tax provisions.
Depreciation and Asset Impairment
Depreciation and asset impairment are both accounting methods that reflect the decline in the value of an asset over time, but they differ significantly in their causes and accounting treatments. Depreciation accounts for the systematic allocation of an asset’s cost over its useful life, reflecting the normal wear and tear or obsolescence. Asset impairment, on the other hand, recognizes a sudden and significant decline in value due to unforeseen circumstances.
Depreciation is a systematic process applied to all assets with a finite useful life, while impairment is an event-driven adjustment applied only when specific criteria are met, indicating a permanent decline in value. Understanding the distinction between these two concepts is crucial for accurate financial reporting.
Circumstances Leading to Asset Impairment
Several factors can trigger asset impairment. These include significant changes in the technological landscape rendering an asset obsolete, unexpected damage or destruction to the asset, a decline in market demand for the goods or services produced by the asset, a significant decrease in the asset’s fair value, or changes in legal requirements impacting the asset’s usability. For example, a manufacturing company might experience asset impairment if a new, more efficient technology is introduced, rendering its existing machinery less valuable. Similarly, a sudden drop in market prices for the products manufactured by a specific machine could also trigger an impairment assessment. Another example could be a natural disaster, like a flood, which significantly damages a building, leading to impairment.
Accounting Treatment for Asset Impairment
When an impairment is identified, companies must follow specific accounting standards to record the loss. The process typically involves comparing the asset’s carrying amount (its original cost less accumulated depreciation) to its recoverable amount. The recoverable amount is the higher of an asset’s fair value less costs to sell and its value in use. If the carrying amount exceeds the recoverable amount, an impairment loss is recognized. This loss is recorded as an expense on the income statement, reducing net income. The carrying amount of the asset is then reduced to its recoverable amount. This adjustment is reflected on the balance sheet, lowering the asset’s reported value. Importantly, impairment losses are not reversible; once recognized, they cannot be reversed if the asset’s value subsequently recovers. For instance, if a company determines that a piece of equipment has a carrying amount of $100,000 but a recoverable amount of only $70,000, a $30,000 impairment loss would be recognized. This loss would be reported on the income statement, and the equipment’s carrying amount on the balance sheet would be reduced to $70,000.
Depreciation and Financial Statement Analysis
Depreciation, while a non-cash expense, significantly impacts a company’s financial statements and subsequent analysis. Understanding its influence on key ratios and metrics is crucial for accurate financial assessment and informed decision-making. This section will explore how depreciation affects various financial statement analyses and the implications of different depreciation methods.
Depreciation’s effect on financial ratios is multifaceted. It directly influences profitability metrics, leverage ratios, and asset turnover, providing insights into a company’s operational efficiency and financial health. Analyzing these impacts requires a careful consideration of the chosen depreciation method and its underlying assumptions.
Analyzing Depreciation’s Impact on Financial Ratios
Analyzing the impact of depreciation on financial ratios involves comparing the ratios calculated using different depreciation methods or comparing a company’s ratios to industry averages while considering the depreciation methods used. For instance, a company using accelerated depreciation will generally show lower net income in the early years compared to a company using straight-line depreciation. This difference will affect profitability ratios like Return on Assets (ROA) and Return on Equity (ROE) in the short term. Over the asset’s life, however, the total depreciation expense will be the same, regardless of the method used. The differences become more relevant when comparing companies using different methods.
Depreciation’s Effect on Key Financial Metrics
Depreciation directly impacts Return on Assets (ROA) and the Debt-to-Equity ratio. ROA, calculated as Net Income/Total Assets, is reduced by higher depreciation expense, leading to a lower ROA. This is because higher depreciation reduces net income. However, the effect on the debt-to-equity ratio is indirect. Accumulated depreciation reduces the book value of assets, potentially affecting the total asset value in the denominator of certain leverage ratios. A lower asset value might result in a slightly higher debt-to-equity ratio, but the effect is usually less pronounced than the impact on profitability ratios.
Implications of Different Depreciation Methods on Financial Statement Analysis
The choice of depreciation method significantly influences financial statement analysis. Different methods allocate depreciation expense differently over an asset’s life, affecting reported profitability and asset values.
- Straight-Line Depreciation: This method evenly distributes depreciation expense over the asset’s useful life. This results in consistent net income and asset values year-over-year, simplifying financial statement analysis. However, it might not accurately reflect the asset’s actual decline in value.
- Accelerated Depreciation (e.g., Double-Declining Balance): This method allocates a larger portion of depreciation expense in the early years of an asset’s life. This results in lower net income initially, potentially impacting ROA and other profitability ratios. However, it can offer tax advantages in the early years. Analyzing financial statements using accelerated depreciation requires careful consideration of the timing of expense recognition.
- Units of Production: This method links depreciation expense to the actual use of the asset. This method provides a more accurate reflection of asset value decline based on actual usage. However, it requires accurate tracking of asset usage, which can be complex and costly.
Understanding the impact of different depreciation methods is crucial for comparing financial statements across companies and over time. Consistent application of a particular method allows for better trend analysis and facilitates accurate benchmarking against industry peers. Inconsistency in depreciation methods makes comparisons difficult and can lead to misleading conclusions.
Depreciation and Capital Budgeting Decisions
Depreciation, while a non-cash expense, significantly influences capital budgeting decisions by affecting a project’s profitability and influencing the choice between competing investment opportunities. Understanding its impact is crucial for making sound financial choices. The method of depreciation chosen can alter the perceived return on investment, impacting the final decision.
Depreciation’s impact on capital budgeting stems from its role in calculating a project’s cash flows. Since depreciation is a tax-deductible expense, it reduces taxable income and, consequently, the amount of tax payable. This tax shield generates a positive cash flow, increasing the overall profitability of the project. Conversely, different depreciation methods can result in varying tax shields over a project’s lifespan, thereby influencing the net present value (NPV) and internal rate of return (IRR).
Depreciation’s Effect on Net Present Value (NPV)
The NPV calculation considers the present value of all future cash flows associated with a project. Depreciation, through its impact on taxes, directly influences these cash flows. A higher depreciation expense in the early years of a project, for example, using the Double-Declining Balance method, will result in a larger tax shield and therefore a higher NPV in the early years compared to using the Straight-Line method. This can make a project appear more attractive initially. Conversely, a lower depreciation expense in the early years using the Straight-Line method may result in a lower NPV initially, but the NPV might be more stable over the project’s life. The optimal depreciation method depends on the project’s specific cash flow profile and the firm’s overall financial goals.
Depreciation’s Effect on Internal Rate of Return (IRR)
The IRR represents the discount rate at which the NPV of a project equals zero. Because depreciation affects the project’s cash flows, it also affects the calculated IRR. A higher depreciation expense, leading to larger tax shields, generally results in a higher IRR. This is because the higher cash flows increase the project’s profitability, making it appear more attractive. However, it’s crucial to remember that the IRR calculation can be sensitive to the timing of cash flows, and different depreciation methods can alter the timing of these flows. Therefore, a higher IRR, influenced by a specific depreciation method, doesn’t always guarantee the best investment decision. A comprehensive analysis considering other factors is crucial.
Considering Depreciation When Evaluating Investment Opportunities
When evaluating investment opportunities, it’s vital to consider the impact of depreciation on the project’s profitability and its implications for the firm’s overall financial health. This involves comparing projects under different depreciation methods to assess their relative attractiveness. A thorough analysis should incorporate the timing of cash flows, the tax implications of each method, and the overall risk profile of the investment. Ignoring the impact of depreciation can lead to inaccurate assessments of profitability and potentially suboptimal investment decisions. For instance, a project with a higher initial investment might appear less attractive initially due to higher depreciation expense, but could ultimately prove to be more profitable over its lifespan.
Epilogue
In conclusion, understanding depreciation is not merely an accounting requirement; it’s a fundamental aspect of financial literacy. The choice of depreciation method significantly impacts a company’s reported financial performance and its overall valuation. By grasping the intricacies of depreciation and its multifaceted effects on financial statements, businesses can make more strategic decisions regarding asset management, tax optimization, and long-term investment planning. A thorough understanding empowers stakeholders to interpret financial reports more effectively and make sound judgments based on accurate financial data.
FAQ Guide
What is the difference between depreciation and amortization?
Depreciation applies to tangible assets (like equipment), while amortization applies to intangible assets (like patents).
Can a company change its depreciation method?
Yes, but changes must be consistently applied and may require disclosure and adjustments to prior periods’ financial statements.
How does depreciation affect a company’s creditworthiness?
Lower net income due to depreciation can reduce profitability ratios, potentially affecting credit ratings. However, it also reflects responsible asset management.
What is the impact of accelerated depreciation methods on cash flow?
Accelerated methods result in higher depreciation expense in early years, leading to lower taxable income and therefore higher cash flow in those early years. The opposite occurs in later years.
In this topic, you find that How to Improve Business Cash Flow with Smart Accounting is very useful.