


How to Conduct a Break-Even Analysis is a crucial skill for any entrepreneur or business owner. Understanding your break-even point – the point where your revenue equals your costs – is fundamental to making informed decisions about pricing, production, and overall business strategy. This guide provides a clear and practical approach to conducting a break-even analysis, empowering you to assess the financial viability of your business ventures with confidence.
We’ll explore the key components of a break-even analysis, including identifying fixed and variable costs, calculating the contribution margin, and finally, determining your break-even point using both units and sales dollars. We’ll also examine the implications of different break-even points and discuss the limitations of this valuable analytical tool. By the end, you’ll possess the knowledge and skills necessary to confidently navigate the financial landscape of your business.
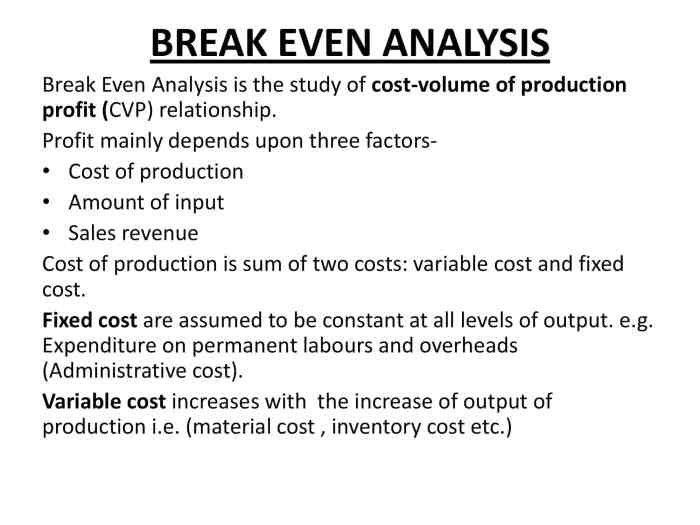
Understanding Break-Even Point
The break-even point is a crucial concept in business finance. It represents the point where total revenue equals total costs, meaning a company is neither making a profit nor incurring a loss. Understanding this point is vital for making informed decisions about pricing, production, and overall business strategy. It provides a benchmark against which a company can measure its performance and identify areas for improvement.
The break-even point is a critical indicator of a business’s financial health and sustainability. Reaching this point signifies that the business has generated enough revenue to cover all its expenses. Beyond this point, every additional sale translates directly into profit.
Break-Even Point Formulas
The break-even point can be calculated in terms of units sold or sales dollars. Both calculations rely on understanding fixed costs (costs that remain constant regardless of production volume, like rent) and variable costs (costs that change with production volume, like raw materials).
Break-even point (units) = Fixed Costs / (Selling Price per Unit – Variable Cost per Unit)
Break-even point (sales dollars) = Fixed Costs / ((Sales Revenue – Variable Costs) / Sales Revenue) or, more simply, Fixed Costs / Contribution Margin Ratio. (Contribution Margin Ratio = (Sales Revenue – Variable Costs) / Sales Revenue)
Industries Where Break-Even Analysis is Crucial
Break-even analysis is particularly important in industries with high fixed costs or significant upfront investments. This includes, but isn’t limited to, manufacturing, hospitality, and the airline industry. For example, a new restaurant needs to accurately estimate its fixed costs (rent, equipment, salaries) and variable costs (food, beverages) to determine how many meals it needs to sell to break even. Similarly, an airline needs to accurately forecast passenger numbers to cover the high fixed costs associated with aircraft purchase and maintenance. Accurate break-even analysis is crucial for these businesses to ensure their pricing strategies are viable and they can operate profitably.
Scenario: A Business Reaching its Break-Even Point
Let’s consider a small bakery that sells custom cakes. Their fixed costs (rent, utilities, oven) are $2,000 per month. The variable cost per cake (ingredients, decorations) is $10. They sell each cake for $30.
Using the formula for break-even point in units:
Break-even point (units) = $2,000 / ($30 – $10) = 100 cakes
This means the bakery needs to sell 100 cakes per month to reach its break-even point. Any cakes sold beyond 100 will generate profit for the bakery. If they sell fewer than 100 cakes, they will operate at a loss. This analysis allows the bakery to set realistic sales targets and make informed decisions about pricing and production.
Identifying Fixed Costs
Accurately identifying your fixed costs is crucial for a precise break-even analysis. Understanding these consistent expenses, regardless of your sales volume, allows for a more realistic projection of profitability. Failing to account for all fixed costs can lead to inaccurate break-even calculations and potentially flawed business decisions.
Fixed costs represent the consistent operational expenses a business incurs regardless of its production or sales levels. These costs are often recurring and predictable, making them relatively easy to budget for. However, meticulously identifying all fixed costs is vital for achieving an accurate break-even point calculation.
Common Fixed Costs for Small Businesses
Three common types of fixed costs for small businesses are rent, salaries, and insurance. Rent represents the cost of leasing a physical space for operations (if applicable). Salaries encompass the consistent compensation paid to employees. Insurance premiums, covering various risks, are another recurring fixed expense. These are just a few examples; others may include loan repayments or software subscriptions.
Determining Total Fixed Costs
To accurately determine a business’s total fixed costs, meticulously list every recurring expense that is not directly tied to production or sales volume. This includes gathering financial statements, reviewing contracts, and consulting with relevant personnel (e.g., accountants, landlords). Sum all these individual fixed costs to arrive at the total. Regularly reviewing and updating this list is important to account for changes in expenses over time. For instance, a lease renewal might lead to a higher monthly rent, impacting the total fixed costs.
Fixed Costs Across Different Business Models
Fixed costs vary significantly between different business models. A brick-and-mortar store will typically have higher fixed costs than an online business due to expenses like rent, utilities, and in-store staffing. Online businesses may have lower rent (or none at all), but they might incur higher costs associated with website maintenance, online advertising, and e-commerce platform fees. A service-based business might have lower fixed costs than a manufacturing business, which often involves significant investment in equipment and facilities. Careful consideration of these differences is necessary for accurate break-even analysis across various business models.
Examples of Fixed Costs
| Fixed Cost | Description | Potential Cost (USD) |
|---|---|---|
| Rent | Monthly cost of leasing business premises | $1,500 |
| Salaries | Monthly payroll for employees | $5,000 |
| Insurance | Annual premiums for various insurance policies | $2,400 |
| Loan Repayments | Monthly payments on business loans | $750 |
Identifying Variable Costs: How To Conduct A Break-Even Analysis
Variable costs are expenses that change in direct proportion to the level of production or sales. Unlike fixed costs, which remain constant regardless of output, variable costs increase as production increases and decrease as production decreases. Understanding these costs is crucial for accurate break-even analysis, as they directly impact the profitability of a business.
Variable costs are directly tied to the volume of goods or services produced. This means that if you produce more, your variable costs will rise, and if you produce less, your variable costs will fall. This relationship is linear, meaning the increase or decrease in cost is consistent with each unit produced. This direct proportionality makes them easily predictable once you understand the cost per unit.
Examples of Variable Costs
Variable costs manifest differently across various business models. Let’s examine examples in manufacturing and service industries.
A manufacturing company’s variable costs might include the raw materials used in production (e.g., steel for car manufacturing, fabric for clothing production), direct labor costs (wages paid to assembly line workers whose hours are directly tied to production volume), and packaging materials. The more cars or clothes produced, the more steel, fabric, and labor will be required, leading to a direct increase in these costs. Conversely, if production slows, these costs will decrease accordingly.
For a service-based business, variable costs could include commissions paid to sales representatives (based on the number of sales made), transaction fees associated with each sale processed, and the cost of materials directly used to provide the service (e.g., printing costs for a design agency, or the cost of materials used by a cleaning service for each client). A higher volume of sales or services rendered directly translates to higher commission payments and transaction fees.
Factors Influencing Variable Cost Fluctuation
Several factors can influence the fluctuation of variable costs, even at seemingly consistent production levels. Understanding these factors is important for accurate forecasting.
- Price Volatility of Raw Materials: Fluctuations in the market price of raw materials directly impact variable costs. For example, a sudden increase in the price of oil will increase the variable costs for a plastic manufacturing company that uses oil-based products.
- Changes in Labor Rates: Wage increases or changes in employee benefits can affect direct labor costs, a significant component of variable costs.
- Supply Chain Disruptions: Delays or shortages in the supply chain can lead to increased costs for raw materials or components, affecting the overall variable cost.
- Technological Advancements: New technologies might reduce the cost of certain materials or processes, lowering variable costs.
- Seasonal Demand: Variable costs can fluctuate with seasonal changes in demand. For example, a clothing manufacturer might experience higher variable costs during peak seasons due to increased production.
Calculating Total Variable Cost, How to Conduct a Break-Even Analysis
Let’s illustrate calculating total variable cost with a hypothetical example. Suppose a bakery produces custom cakes. The variable cost per cake is $15, encompassing ingredients, direct labor, and packaging.
| Production Level (Cakes) | Variable Cost per Cake ($) | Total Variable Cost ($) |
|---|---|---|
| 10 | 15 | 150 |
| 50 | 15 | 750 |
| 100 | 15 | 1500 |
| 200 | 15 | 3000 |
Total Variable Cost = Variable Cost per Unit * Number of Units Produced
This simple calculation demonstrates the direct relationship between production volume and total variable cost. As the number of cakes produced increases, so does the total variable cost, in a directly proportional manner.
Calculating Contribution Margin
The contribution margin is a crucial element in break-even analysis. It represents the portion of revenue that’s available to cover fixed costs and contribute to profit after variable costs have been deducted. Understanding the contribution margin allows businesses to assess the profitability of individual products or services and make informed decisions about pricing, production, and sales strategies.
The contribution margin is calculated in two ways: per unit and as a ratio. Both provide valuable insights into a business’s financial health and its capacity to generate profits.
Contribution Margin Per Unit and Ratio Calculation
The contribution margin per unit is the difference between the selling price of a product and its variable costs. This metric indicates how much each unit sold contributes towards covering fixed costs and generating profit. The formula is:
Contribution Margin per Unit = Selling Price per Unit – Variable Cost per Unit
The contribution margin ratio, expressed as a percentage, shows the proportion of revenue available to cover fixed costs and generate profit. It’s calculated as:
Contribution Margin Ratio = (Selling Price per Unit – Variable Cost per Unit) / Selling Price per Unit x 100%
Alternatively, it can be calculated using total figures:
Contribution Margin Ratio = (Revenue – Variable Costs) / Revenue x 100%
Contribution Margin Example
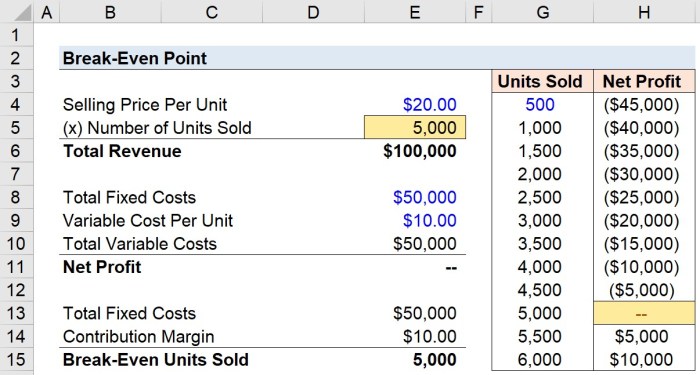
Let’s consider a company that manufactures and sells widgets. Each widget sells for $20, and the variable cost to produce each widget is $10 (including materials, direct labor, and variable overhead).
* Contribution Margin per Unit: $20 (Selling Price) – $10 (Variable Cost) = $10
* Contribution Margin Ratio: ($20 – $10) / $20 x 100% = 50%
This means that for each widget sold, $10 is available to cover fixed costs like rent, salaries, and depreciation. The contribution margin ratio of 50% indicates that 50% of every dollar of revenue contributes towards covering fixed costs and generating profit.
Comparison of Contribution Margin to Other Profitability Measures
The contribution margin offers a unique perspective on profitability compared to other measures. Here’s a comparison:
The following table summarizes the key differences and provides context for choosing the appropriate metric depending on the specific business needs.
Investigate the pros of accepting How to Set Up Payroll for Small Businesses in your business strategies.
| Profitability Measure | Description | Focus | Limitations |
|---|---|---|---|
| Contribution Margin | Revenue minus variable costs | Contribution towards fixed costs and profit | Doesn’t account for fixed costs directly |
| Gross Profit | Revenue minus cost of goods sold (includes both fixed and variable costs) | Overall profitability of sales | Can be misleading if fixed costs are significantly high |
| Net Profit | Revenue minus all costs (fixed and variable) | Overall profitability after all expenses | Doesn’t highlight the contribution of individual products |
| Operating Profit | Revenue minus cost of goods sold and operating expenses | Profitability from core business operations | Excludes certain non-operating income and expenses |
Performing the Break-Even Analysis
Now that we understand the components of a break-even analysis – fixed costs, variable costs, and the contribution margin – let’s put it all together. This section details the step-by-step process, illustrating the calculations with a numerical example using both unit and sales dollar methods.
Break-Even Analysis: A Step-by-Step Guide
The break-even point is where total revenue equals total costs. To find this point, we can use either the unit method (calculating the number of units to sell) or the sales dollar method (calculating the total revenue needed). Both methods yield the same break-even point, expressed differently.
Break-Even Point Calculation: Unit Method
This method calculates the number of units that need to be sold to cover all costs. The formula is:
Break-Even Point (Units) = Fixed Costs / (Selling Price per Unit – Variable Cost per Unit)
Let’s consider a small bakery. Their fixed costs (rent, salaries, etc.) are $5,000 per month. They sell each loaf of bread for $5, and the variable cost per loaf (flour, ingredients, etc.) is $2.
Applying the formula:
Break-Even Point (Units) = $5,000 / ($5 – $2) = 1667 units
The bakery needs to sell 1667 loaves of bread to break even.
Break-Even Point Calculation: Sales Dollar Method
This method calculates the total revenue needed to cover all costs. The formula is:
Break-Even Point (Sales Dollars) = Fixed Costs / ((Selling Price per Unit – Variable Cost per Unit) / Selling Price per Unit)
Using the same bakery example:
Break-Even Point (Sales Dollars) = $5,000 / (($5 – $2) / $5) = $8333.33
The bakery needs to generate $8333.33 in revenue to break even.
Comparing Unit and Sales Dollar Methods
Both methods provide the same break-even point, but expressed differently. The unit method tells us the number of units to sell (1667 loaves), while the sales dollar method tells us the total revenue needed ($8333.33). The results are consistent; selling 1667 loaves at $5 each generates $8335 in revenue, which is very close to our calculated break-even sales dollars, accounting for minor rounding differences.
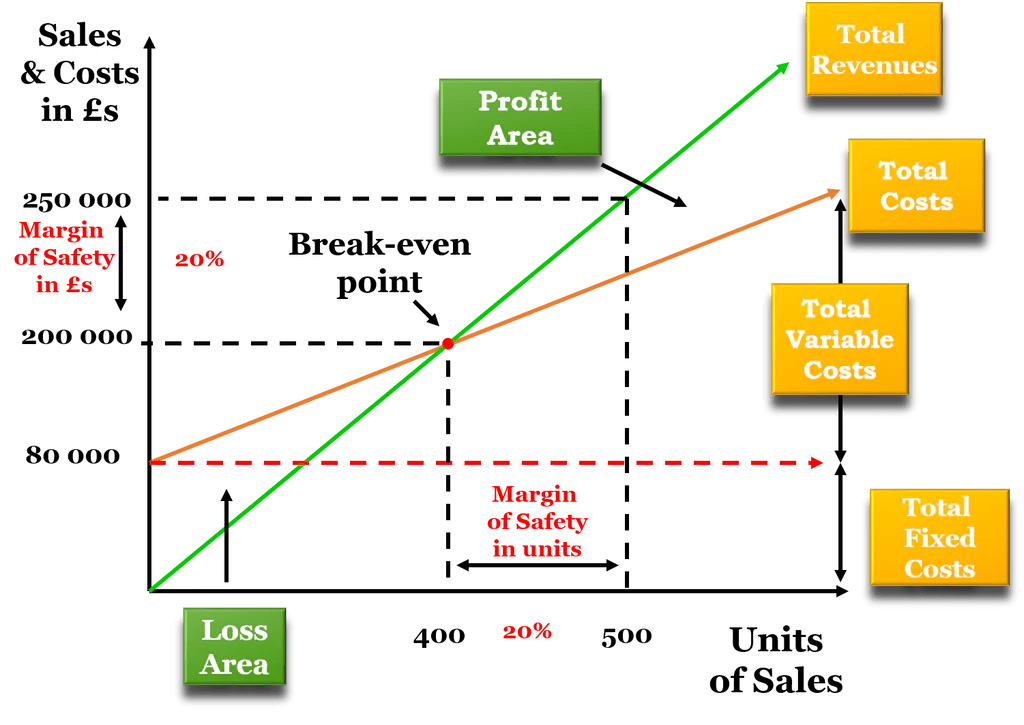
Visual Representation of the Break-Even Point
Imagine a graph with two lines. The horizontal (x-axis) represents the number of units sold, and the vertical (y-axis) represents the total revenue and total costs in dollars. The total cost line starts at the y-intercept representing fixed costs and slopes upward, reflecting the increase in total costs as more units are produced. The total revenue line starts at the origin (0,0) and slopes upward, representing the increasing revenue with each unit sold. The point where these two lines intersect is the break-even point. At this point, total revenue equals total costs. In our bakery example, the break-even point would be at approximately 1667 units on the x-axis and $8333 on the y-axis. The area to the right of the intersection represents profit, and the area to the left represents loss.
Analyzing the Results and Sensitivity Analysis
Understanding your break-even point is only the first step. Analyzing the results and performing a sensitivity analysis provides crucial insights into your business’s financial health and resilience. This involves examining the implications of your break-even point and exploring how changes in various factors could affect it.
Implications of High versus Low Break-Even Points
A low break-even point indicates that a business needs to sell fewer units to cover its costs and start generating profit. This is generally a positive sign, suggesting efficiency and potentially higher profitability. Conversely, a high break-even point signifies that a business needs to sell a larger volume of goods or services to reach profitability, making it more vulnerable to market fluctuations and potentially less profitable. For example, a small online store with low overhead costs might have a low break-even point, while a large manufacturing plant with significant capital investment would likely have a much higher one. The ideal break-even point is relative to the industry and business model.
Factors Shifting the Break-Even Point
Several key factors can significantly influence a company’s break-even point. Changes in fixed costs, variable costs, and selling price all directly impact the calculation. For instance, an increase in rent (fixed cost) would raise the break-even point, requiring more sales to cover the increased expense. Similarly, a rise in raw material prices (variable cost) would also increase the break-even point. Conversely, a price increase (selling price) would lower the break-even point, as fewer units need to be sold to cover costs. Furthermore, increased efficiency leading to lower variable costs per unit would also lower the break-even point. Consider a bakery: if the cost of flour (variable) increases, they’d need to sell more bread to break even. If they raise bread prices, they’d need to sell less. If they find a more efficient oven (reducing fixed costs), they’d also need to sell less.
Limitations of Break-Even Analysis
While break-even analysis is a valuable tool, it’s essential to acknowledge its limitations. It’s a simplified model that doesn’t account for several real-world complexities. For example, it assumes a constant selling price and constant costs per unit, which may not always hold true. Market demand, changes in consumer preferences, and unforeseen economic conditions are not factored into the basic break-even calculation. Furthermore, it doesn’t consider the time value of money, meaning it doesn’t account for the potential impact of inflation or interest rates on the overall profitability. Finally, it offers a static view; a business’s costs and sales are rarely static.
Sensitivity Analysis Table
The following table illustrates how changes in fixed costs, variable costs, and selling price impact the break-even point. Note that this is a simplified example and actual results may vary. We assume an initial scenario with fixed costs of $10,000, variable costs per unit of $5, and a selling price of $10. The initial break-even point is calculated as Fixed Costs / (Selling Price – Variable Cost) = $10,000 / ($10 – $5) = 2,000 units.
| Scenario | Fixed Costs | Variable Costs/Unit | Selling Price/Unit | Break-Even Point (Units) |
|---|---|---|---|---|
| Initial | $10,000 | $5 | $10 | 2,000 |
| Increased Fixed Costs | $15,000 | $5 | $10 | 3,000 |
| Increased Variable Costs | $10,000 | $6 | $10 | 2,500 |
| Increased Selling Price | $10,000 | $5 | $12 | 1,667 |
Summary
Mastering the art of break-even analysis is a significant step towards building a sustainable and profitable business. By understanding your break-even point, you can effectively manage costs, optimize pricing strategies, and make data-driven decisions that contribute to long-term success. Remember that while a break-even analysis provides valuable insights, it’s crucial to consider it alongside other financial metrics and market analysis for a holistic understanding of your business’s financial health. Regularly reviewing and updating your break-even analysis, factoring in market changes and business growth, is essential for maintaining a clear picture of your financial trajectory.
Answers to Common Questions
What if my break-even point is very high?
A high break-even point suggests your costs are significantly high relative to your revenue. You might need to re-evaluate your pricing strategy, explore ways to reduce costs, or increase sales volume to achieve profitability.
Can I use break-even analysis for a non-profit organization?
Yes, break-even analysis can be adapted for non-profits. Instead of focusing on profit, you would analyze the point where revenue covers expenses, ensuring the organization’s sustainability.
How often should I conduct a break-even analysis?
Ideally, you should perform a break-even analysis regularly, at least annually, or more frequently if there are significant changes in your business, such as price increases, new product launches, or shifts in market conditions.
What are the limitations of a break-even analysis?
Break-even analysis is a simplified model. It doesn’t account for factors like seasonality, changes in customer demand, or unforeseen economic fluctuations. It’s a useful tool but shouldn’t be the sole basis for major business decisions.