


Cash Flow Statement Explained: Understanding a company’s cash flow is crucial for assessing its financial health and future prospects. This statement reveals the movement of cash both into and out of a business over a specific period, offering insights beyond what traditional profit and loss statements can provide. We’ll explore the three key sections – operating, investing, and financing activities – and how analyzing them can paint a comprehensive picture of a company’s financial performance and liquidity.
This explanation will cover the different methods used to prepare a cash flow statement, the key metrics to watch for, and the limitations of this crucial financial tool. We will use real-world examples to illustrate how businesses use cash flow statements for decision-making, planning, and overall financial management.
Introduction to Cash Flow Statements
Understanding a company’s financial health goes beyond simply looking at its profits. A crucial piece of the puzzle is the cash flow statement, a financial statement that provides a detailed picture of the cash inflows and outflows of a business over a specific period. This statement is vital for assessing a company’s liquidity, its ability to meet its short-term obligations, and its overall financial stability.
Cash flow represents the actual movement of money into and out of a business. It’s different from accounting profit, which can be influenced by non-cash transactions like depreciation. Understanding cash flow is paramount because a business can be profitable on paper (accrual accounting) yet still struggle to pay its bills due to insufficient cash on hand. A healthy cash flow ensures a company can meet its operational needs, invest in growth opportunities, and weather financial storms.
Real-World Applications of Cash Flow Statements
Cash flow statements serve various purposes in the business world. They are indispensable tools for decision-making at all levels of an organization.
- Financial Planning and Forecasting: Businesses use cash flow statements to predict future cash needs and surpluses. This allows them to plan for potential shortfalls, secure financing if necessary, and make informed decisions about investments and expansion. For example, a retail company might use its cash flow statement to determine how much inventory it can afford to purchase for the upcoming holiday season, based on projected sales and expenses.
- Investment Decisions: Investors use cash flow statements to evaluate the financial health and stability of companies they are considering investing in. Strong and consistent positive cash flow is a key indicator of a company’s ability to generate returns for its investors. A company with a history of strong free cash flow, for instance, is generally considered a safer investment than one with inconsistent or negative cash flow.
- Creditworthiness Assessment: Lenders use cash flow statements to assess a company’s ability to repay loans. A healthy cash flow demonstrates the borrower’s capacity to make timely payments, reducing the lender’s risk. A small business seeking a loan to expand its operations, for example, will need to present a compelling cash flow statement to convince the bank of its repayment capacity.
Accrual Accounting versus Cash Accounting
Accrual accounting recognizes revenue when it is earned and expenses when they are incurred, regardless of when cash changes hands. Cash accounting, on the other hand, only records transactions when cash is actually received or paid out. The cash flow statement reconciles these two accounting methods, providing a clear picture of the actual cash movements within a business. For instance, a company might record revenue in accrual accounting before receiving the payment; the cash flow statement would show the cash inflow only when the payment is received. This distinction is critical for a comprehensive understanding of a company’s financial position.
Components of a Cash Flow Statement
The cash flow statement provides a comprehensive overview of a company’s cash inflows and outflows over a specific period. Understanding its components is crucial for assessing a company’s liquidity, solvency, and overall financial health. This statement differs significantly from the income statement, which focuses on accrual accounting, by providing a clear picture of actual cash movements.
The Three Main Sections of a Cash Flow Statement
The cash flow statement is divided into three primary sections, each reflecting different aspects of a company’s cash activities: operating activities, investing activities, and financing activities. These sections work together to present a complete picture of the company’s cash position.
Cash Flows from Operating Activities
This section details the cash generated or used by a company’s core business operations. It reflects the cash inflows and outflows resulting from the day-to-day activities necessary to run the business. Positive cash flow from operations generally indicates a healthy and sustainable business model.
Cash Flows from Investing Activities
This section focuses on cash flows related to a company’s investments in long-term assets and securities. These activities primarily involve the purchase and sale of assets such as property, plant, and equipment (PP&E), investments in other companies, and acquisitions. Significant capital expenditures will typically result in net cash outflows in this section.
Cash Flows from Financing Activities
This section tracks cash flows related to how the company funds its operations. It includes activities such as issuing debt (loans, bonds), issuing equity (stock), repurchasing stock, paying dividends, and repaying debt. A company may experience both inflows and outflows in this section depending on its financing strategy.
Examples of Cash Flows in Each Section
The following table provides examples of cash inflows and outflows for each section of the cash flow statement:
| Activity Type | Cash Inflow | Cash Outflow |
|---|---|---|
| Operating Activities | Sales revenue, collection of accounts receivable, interest received | Payment of salaries, rent, utilities, taxes, purchase of inventory |
| Investing Activities | Sale of equipment, sale of securities | Purchase of equipment, purchase of securities, acquisition of another company |
| Financing Activities | Issuance of debt, issuance of equity, proceeds from loan | Repayment of debt, payment of dividends, repurchase of company stock |
Contribution of Each Section to the Overall Cash Position
Understanding the cash flow from each section is critical for a holistic view of a company’s financial health.
- Operating Activities: This section reveals the company’s ability to generate cash from its core business. Strong positive cash flow from operations suggests a sustainable business model and ability to meet its short-term obligations.
- Investing Activities: This section indicates the company’s investment strategy and its impact on cash. Significant outflows may reflect growth initiatives, while inflows may signal divestment or asset sales.
- Financing Activities: This section highlights the company’s reliance on debt or equity financing and its ability to manage its capital structure. Consistent reliance on debt financing might indicate higher risk.
Analyzing Cash Flow from Operating Activities
Understanding cash flow from operating activities is crucial for assessing a company’s ability to generate cash from its core business operations. This section will delve into the two primary methods of reporting operating cash flows – the direct and indirect methods – highlighting their differences, advantages, and disadvantages. We will also explore how to interpret key metrics derived from operating cash flow data.
Direct Method of Reporting Operating Cash Flows
The direct method reports operating cash flows by directly showing the cash inflows and outflows from operating activities. This involves listing each cash receipt and payment related to operations. For example, cash received from customers, cash paid to suppliers, and cash paid for salaries would all be individually reported. While this provides a clear and transparent picture of cash movements, it’s often less frequently used due to its complexity and the need for detailed cash records.
Indirect Method of Reporting Operating Cash Flows
The indirect method starts with net income and adjusts it to arrive at operating cash flow. This method uses accrual accounting data and makes adjustments to reconcile net income to a cash basis. This approach is more common due to its relative simplicity and the readily available data from a company’s financial statements.
Comparison of Direct and Indirect Methods
The following table summarizes the key differences between the direct and indirect methods:
| Feature | Direct Method | Indirect Method |
|---|---|---|
| Starting Point | Cash receipts and payments | Net income |
| Complexity | More complex | Less complex |
| Data Requirements | Requires detailed cash records | Uses accrual accounting data |
| Transparency | More transparent | Less transparent |
| Frequency of Use | Less frequently used | More frequently used |
Examples of Adjustments in the Indirect Method
Many adjustments are needed when using the indirect method to convert net income to cash flow from operations. These adjustments account for non-cash items included in net income.
- Depreciation and Amortization: These are non-cash expenses added back to net income because they don’t represent actual cash outflows.
- Changes in Current Assets and Liabilities: Increases in current assets (like accounts receivable) reduce cash flow, while increases in current liabilities (like accounts payable) increase cash flow. Conversely, decreases in current assets increase cash flow, and decreases in current liabilities reduce cash flow.
- Gains and Losses: Gains on the sale of assets are subtracted, and losses are added back to net income. These are non-operating items and don’t reflect cash flow from operations.
For example, if a company’s net income is $100,000, and depreciation is $10,000, and accounts receivable increased by $5,000, the operating cash flow using the indirect method would be calculated as follows: $100,000 (Net Income) + $10,000 (Depreciation) – $5,000 (Increase in Accounts Receivable) = $105,000.
Interpreting Key Metrics from Operating Cash Flow
Operating cash flow is a key indicator of a company’s financial health. A strong and consistent operating cash flow suggests the company is effectively managing its core business and generating sufficient cash to meet its obligations. Analyzing operating cash flow in relation to net income can reveal valuable insights. For instance, a significant difference between net income and operating cash flow might indicate aggressive accounting practices or significant non-cash items. Comparing operating cash flow trends over time can also help identify potential problems or improvements in a company’s operational efficiency. A declining operating cash flow, for example, might signal weakening demand or rising costs. Conversely, a consistently increasing operating cash flow typically indicates a healthy and growing business.
Analyzing Cash Flow from Investing Activities
Investing activities represent a crucial aspect of a company’s financial health, reflecting its strategies for growth and long-term value creation. Understanding the cash flows associated with these activities provides insights into management’s capital allocation decisions and their impact on the company’s future prospects. Analyzing this section of the cash flow statement helps investors and stakeholders assess the company’s investment in its future.
The investing activities section of the cash flow statement primarily focuses on changes in long-term assets. This section reveals how a company is using its resources to expand its operations, upgrade its equipment, or acquire other businesses. A positive cash flow from investing activities generally suggests a company is strategically investing in its future, while a negative flow might indicate significant capital expenditures or acquisitions. However, the context is critical; a negative flow isn’t inherently bad, especially for a growing company.
Capital Expenditures (CAPEX) and Their Significance
Capital expenditures, or CAPEX, represent cash outflows associated with acquiring or upgrading long-term assets. These assets typically have a useful life of more than one year and contribute to the company’s operational capacity. Understanding CAPEX is vital because it indicates a company’s commitment to maintaining and expanding its operational capabilities. High CAPEX often signifies growth and future potential, though it can also indicate a need for substantial investment to remain competitive. Conversely, low or declining CAPEX may suggest a lack of investment in future growth or potential obsolescence of existing assets. The analysis should consider the industry context and the company’s specific circumstances.
Types of Investing Activities Reported
Investing activities encompass a broad range of transactions. These include purchases and sales of long-term assets, such as property, plant, and equipment (PP&E), investments in other companies (securities), and acquisitions or divestitures of businesses. Acquisitions represent the purchase of another company, leading to a cash outflow, while divestitures are the sales of parts of a business, generating a cash inflow. The net effect of these activities reflects the overall investment strategy of the company.
Examples of Investing Activities and Their Impact on Cash Flow
The following list illustrates various investing activities and their effect on cash flow:
- Purchase of Property, Plant, and Equipment (PP&E): Purchasing new machinery or a building results in a cash outflow, decreasing net cash flow from investing activities. For example, a manufacturing company investing $1 million in new production equipment would show a -$1 million outflow.
- Acquisition of another company: Acquiring a competitor for $50 million would significantly reduce cash flow from investing activities by -$50 million. This is a substantial investment, indicating growth aspirations.
- Sale of Equipment: Selling old machinery for $100,000 would increase cash flow from investing activities by +$100,000. This could reflect streamlining operations or asset optimization.
- Investment in Securities: Investing $2 million in the stock of another company represents a cash outflow, decreasing net cash flow from investing activities by -$2 million. This reflects diversification or strategic investment.
- Divestiture of a Business Segment: Selling a non-core business unit for $3 million would increase cash flow from investing activities by +$3 million. This usually indicates a strategic shift to focus on core competencies.
Interpreting Changes in Long-Term Assets
Changes in long-term assets are directly reflected in the investing activities section of the cash flow statement. An increase in long-term assets, such as PP&E, usually indicates significant capital expenditures, representing a cash outflow. Conversely, a decrease in long-term assets, potentially due to asset sales or divestitures, typically results in a cash inflow. Analyzing these changes in conjunction with the company’s strategic goals and industry dynamics provides valuable insights into the company’s investment strategy and financial health. For instance, a significant increase in PP&E coupled with strong revenue growth could indicate healthy expansion, while a decrease in PP&E accompanied by declining revenue might signal financial distress or restructuring.
Analyzing Cash Flow from Financing Activities
The cash flow statement’s financing activities section reveals how a company secures and manages its long-term funding. Understanding this section is crucial for assessing a company’s financial health and its ability to meet its obligations. It provides insights into the company’s capital structure and its reliance on debt versus equity.
Financing Activities Examples
Financing activities encompass transactions that alter a company’s capital structure. These activities directly impact the long-term financial health and stability of the business. Key examples include issuing debt (like bonds or loans), issuing equity (selling stock), repurchasing shares, paying dividends, and repaying debt. Analyzing these activities helps investors and creditors understand how the company funds its operations and growth.
Implications of Changes in Debt and Equity Financing
Changes in a company’s debt levels significantly impact its cash flow. Taking on new debt provides an immediate cash inflow, but increases future cash outflows due to interest payments and principal repayments. High levels of debt can increase financial risk, potentially leading to difficulties in meeting obligations. Conversely, equity financing, while diluting ownership, doesn’t create a mandatory cash outflow obligation beyond potential future dividends. However, it reduces the earnings per share available to existing shareholders. The optimal balance between debt and equity financing depends on various factors, including the company’s risk tolerance, industry norms, and access to capital markets. A company with consistently increasing debt levels may indicate a reliance on borrowing to fund operations, a factor that requires careful consideration.
Impact of Dividends Paid on Cash Flow
Dividends paid represent a cash outflow. They reduce the company’s available cash for reinvestment, debt reduction, or other strategic initiatives. The decision to pay dividends signals management’s confidence in the company’s future cash flows. However, excessive dividend payments can strain a company’s liquidity, particularly if it is experiencing financial difficulties. Companies with limited cash flow might choose to reduce or suspend dividend payments to conserve cash. A consistent dividend payment policy, however, can attract investors who value regular income streams.
Comparison of Financing Options
The table below compares the immediate and long-term cash flow impacts of different financing methods.
| Financing Method | Immediate Cash Impact | Long-Term Impact |
|---|---|---|
| Issuing Bonds | Cash inflow from bond proceeds | Cash outflow for interest payments and principal repayment; increased financial leverage |
| Issuing Stock | Cash inflow from stock sale | No mandatory cash outflow (except for potential future dividends); diluted ownership |
| Repurchasing Shares | Cash outflow for share buyback | Reduced number of outstanding shares, potentially increasing EPS; reduced cash available for other investments |
| Repaying Debt | Cash outflow for debt repayment | Reduced interest expense, improved financial health, decreased financial leverage |
Interpreting the Overall Cash Flow Statement
The cash flow statement, unlike the income statement or balance sheet, provides a direct view of a company’s cash inflows and outflows over a period. Understanding this statement is crucial for assessing a company’s liquidity, solvency, and overall financial health. By analyzing the three core sections – operating, investing, and financing activities – we can gain valuable insights into a company’s ability to generate cash, manage its assets, and fund its operations.
Assessing Overall Liquidity
A company’s liquidity, its ability to meet its short-term obligations, is directly reflected in its cash flow statement. Positive cash flow from operating activities is a strong indicator of good liquidity, suggesting the company is generating sufficient cash from its core business to cover its immediate expenses. Conversely, consistently negative operating cash flow raises serious concerns about a company’s ability to pay its bills. Analyzing the change in cash and cash equivalents over the period, as reported at the bottom of the statement, also provides a clear picture of the company’s overall cash position. A significant increase suggests strong liquidity, while a substantial decrease warrants closer examination.
Free Cash Flow Calculation and Interpretation
Free cash flow (FCF) represents the cash a company generates after accounting for capital expenditures (CapEx) necessary to maintain or expand its operations. It’s a crucial metric for assessing a company’s ability to pay dividends, repurchase its stock, pay down debt, or invest in new projects. The formula for calculating free cash flow is:
Free Cash Flow = Cash Flow from Operating Activities – Capital Expenditures + Proceeds from Sale of Property, Plant, and Equipment
A high and consistent free cash flow suggests a healthy and financially robust company, while a low or negative FCF could signal financial distress. Investors often use FCF to evaluate investment opportunities, as it directly reflects the cash available for distribution to shareholders or reinvestment.
Relationship Between Cash Flow Statement, Balance Sheet, and Income Statement
The cash flow statement, balance sheet, and income statement are interconnected financial statements that provide a comprehensive view of a company’s financial performance. The income statement reports revenues and expenses, resulting in net income. However, net income doesn’t equal cash generated, as it includes non-cash items like depreciation and amortization. The cash flow statement reconciles net income with actual cash flows, clarifying the discrepancy. The balance sheet shows a company’s assets, liabilities, and equity at a specific point in time. Changes in balance sheet accounts, such as accounts receivable and inventory, are reflected in the cash flow statement, showing the impact on cash flows. For example, an increase in accounts receivable reduces cash flow from operations, as sales are recorded before cash is received.
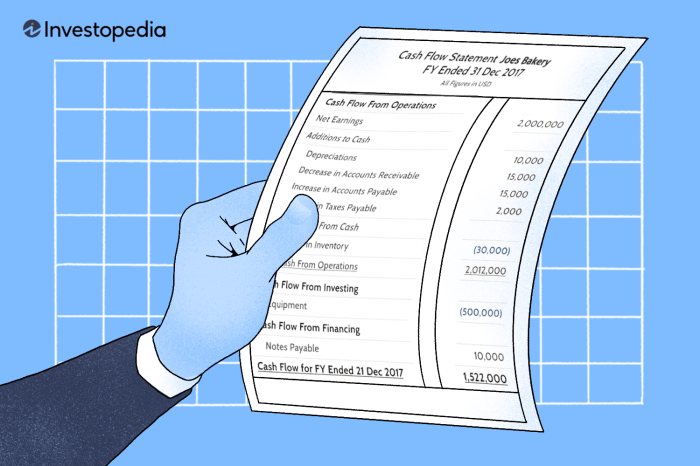
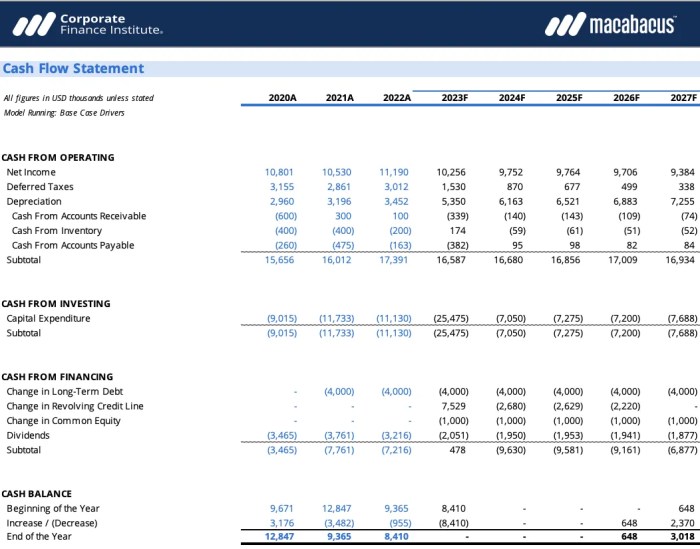
Hypothetical Company Cash Flow Statement and Financial Health Analysis
Let’s consider “XYZ Corp,” a hypothetical manufacturing company. Its cash flow statement for the year ended December 31, 2023, shows:
* Cash Flow from Operating Activities: $50 million (positive, indicating strong core business performance)
* Cash Flow from Investing Activities: -$20 million (negative, due to investments in new equipment and property)
* Cash Flow from Financing Activities: $10 million (positive, possibly from debt financing or equity issuance)
* Net Increase in Cash and Cash Equivalents: $40 million (positive, indicating a strong overall cash position)
Based on this data, XYZ Corp appears to be in relatively good financial health. The positive operating cash flow demonstrates its ability to generate cash from its operations. The negative investing cash flow is expected for a growing company reinvesting in its future. The positive net increase in cash confirms the company’s strong liquidity and ability to manage its cash effectively. However, a deeper dive into the specifics of the investing activities and the nature of the financing would provide a more comprehensive assessment. For instance, excessive reliance on debt financing could be a concern in the long term.
Limitations of Cash Flow Statements
Cash flow statements, while powerful tools for financial analysis, are not without their limitations. Understanding these limitations is crucial for a complete and accurate interpretation of a company’s financial health. Factors such as accounting choices, non-cash transactions, and the potential for manipulation can all influence the reported cash flows and affect the conclusions drawn from the statement.
Impact of Accounting Methods on Reported Cash Flows
The choice of accounting methods significantly impacts the reported cash flows. Different depreciation methods, for instance, directly affect the cash flow from investing activities. Accelerated depreciation, which recognizes higher depreciation expense in the early years of an asset’s life, will result in lower reported net cash flow from operating activities in those years compared to straight-line depreciation. Similarly, the inventory valuation method (FIFO or LIFO) can affect the reported cash flows from operating activities, as the cost of goods sold calculation differs under each method, influencing the net income and subsequently the cash flow. These variations highlight the need for careful comparison of companies using different accounting methods.
Influence of Non-Cash Transactions on Cash Flow Interpretation
Non-cash transactions, by definition, do not involve the actual exchange of cash. However, they significantly impact a company’s financial position and can be misleading if not carefully considered within the context of the cash flow statement. Examples include the acquisition of assets through debt financing (increasing liabilities but not directly affecting cash flow from financing activities), the issuance of stock for an acquisition (increasing equity but not directly affecting cash flow from financing activities), and the use of accrual accounting for expenses and revenues (which can differ significantly from actual cash receipts and payments). These transactions, while crucial to the overall financial picture, are not reflected in the cash flow statement itself and need to be separately analyzed.
Potential for Manipulation of Cash Flow Statements, Cash Flow Statement Explained
While less common than earnings manipulation, companies can still engage in practices that distort their cash flow statements. One method involves aggressive revenue recognition, accelerating the timing of cash inflows and potentially overstating cash from operating activities. Conversely, delaying the recognition of expenses can artificially inflate cash flows. Another tactic might involve classifying operating cash flows as investing or financing cash flows to improve the appearance of operating performance. Detecting such manipulations requires a thorough analysis of the statement in conjunction with other financial statements and a critical examination of the company’s disclosures and accounting practices. For example, a company might aggressively pursue short-term financing to boost its cash balance temporarily, creating a misleadingly positive picture of its liquidity. Such actions might not be sustainable in the long term.
Conclusive Thoughts: Cash Flow Statement Explained
Mastering the interpretation of cash flow statements empowers you to make informed financial decisions, whether you’re an investor analyzing a company’s performance, a business owner monitoring your own financial health, or a student gaining a deeper understanding of financial accounting. By understanding the nuances of operating, investing, and financing activities, and recognizing potential limitations, you can leverage the insights provided by a cash flow statement to gain a more complete financial picture.
FAQ Resource
What is the difference between net income and cash flow?
Net income reflects profits based on accrual accounting (revenue recognized when earned, expenses when incurred), while cash flow shows the actual cash inflows and outflows during a period. They can differ significantly due to timing differences in revenue recognition and expense payments.
How can a company’s cash flow be negative, yet still be profitable?
A company can be profitable (positive net income) but have negative cash flow if it invests heavily in capital expenditures (CAPEX), experiences delays in collecting receivables, or has significant inventory build-up. Accrual accounting recognizes revenue and expenses differently than the actual cash movements.
Why is free cash flow important?
Free cash flow (FCF) represents the cash available to a company after covering operating expenses and capital expenditures. It’s a key indicator of a company’s ability to pay dividends, repay debt, or reinvest in growth opportunities.
You also can investigate more thoroughly about Payroll Tax Basics for Employers to enhance your awareness in the field of Payroll Tax Basics for Employers.