


What is a Balance Sheet? Simple Explanation: Understanding a balance sheet is crucial for grasping a company’s financial health. Think of it like a snapshot of a company’s assets, liabilities, and equity at a specific point in time. This simple explanation will demystify this fundamental financial statement, providing a clear understanding of its components and how to interpret its information. We’ll explore its key elements, including assets (what a company owns), liabilities (what a company owes), and equity (the owners’ stake), and demonstrate how these components interact to present a comprehensive picture of a company’s financial position.
This explanation will delve into the practical application of understanding a balance sheet, offering insights into how to analyze a company’s financial health using key ratios and interpreting the information presented. We will also explore the limitations of relying solely on a balance sheet for financial analysis and discuss the importance of considering it alongside other financial statements for a more complete picture. By the end, you’ll be equipped to confidently interpret a balance sheet and use it to make informed decisions.
Introduction to the Balance Sheet
A balance sheet is a financial statement that provides a snapshot of a company’s assets, liabilities, and equity at a specific point in time. Think of it as a photograph of a company’s financial health on a particular date. It shows what a company owns (assets), what it owes (liabilities), and the difference between the two (equity), which represents the owners’ stake in the company. Understanding a balance sheet is crucial for anyone interested in assessing a company’s financial position.
The purpose of a balance sheet is to give stakeholders – including investors, creditors, and management – a clear picture of a company’s financial standing. This allows them to make informed decisions about investing, lending, or managing the business. By analyzing the relationships between assets, liabilities, and equity, users can evaluate a company’s liquidity (ability to meet short-term obligations), solvency (ability to meet long-term obligations), and overall financial health.
A Real-World Analogy of a Balance Sheet
Imagine you’re running a lemonade stand. Your assets would include the cash in your register, the lemons and sugar you have in stock, your lemonade stand itself, and any other equipment you own. Your liabilities would be any money you owe, like a loan you took out to buy your equipment. Your equity is what’s left over after you subtract your liabilities from your assets – it represents your ownership in the lemonade stand. This simple example mirrors the core components of a balance sheet: Assets = Liabilities + Equity. The balance sheet ensures that both sides of the equation always balance.
A Brief History of the Balance Sheet
While the exact origins are debated, the balance sheet’s fundamental concept has roots in ancient accounting practices. Early forms of balance sheets appeared in ancient civilizations, primarily used for tracking assets and debts. However, the standardized format and principles we recognize today evolved gradually over centuries. The development of double-entry bookkeeping in the 15th century, credited to Luca Pacioli, significantly contributed to the refinement of the balance sheet. This system, which records every transaction with a debit and a credit entry, ensured the balance sheet always remained balanced, enhancing its reliability and accuracy. Over time, accounting standards and regulations have further formalized the balance sheet’s structure and reporting requirements, making it a crucial tool for financial analysis and decision-making.
Key Components of a Balance Sheet
The balance sheet is a fundamental financial statement that provides a snapshot of a company’s financial position at a specific point in time. Understanding its key components is crucial for interpreting a company’s assets, liabilities, and equity. This section will break down the three main sections of a balance sheet and illustrate their significance.
The balance sheet adheres to the fundamental accounting equation: Assets = Liabilities + Equity. This equation highlights the interconnectedness of the three main components.
The Three Main Sections of a Balance Sheet
The balance sheet is divided into three core sections: Assets, Liabilities, and Equity. Each section represents a different aspect of a company’s financial standing, and together they paint a complete picture.
Assets
Assets represent what a company owns. These are resources controlled by the company as a result of past events and from which future economic benefits are expected to flow to the entity. Assets are typically categorized into current assets (those expected to be converted into cash or used within one year) and non-current assets (those with a longer lifespan).
Liabilities
Liabilities represent what a company owes to others. These are present obligations of the entity arising from past events, the settlement of which is expected to result in an outflow from the entity of resources embodying economic benefits. Liabilities are also categorized into current liabilities (due within one year) and non-current liabilities (due after one year).
Equity
Equity represents the residual interest in the assets of the entity after deducting all its liabilities. It’s essentially the owners’ stake in the company. For a corporation, this is often referred to as shareholder’s equity. For a sole proprietorship or partnership, it represents the owner’s capital.
Balance Sheet Structure
The following table illustrates the basic structure of a balance sheet, showcasing the relationship between assets, liabilities, and equity.
| Assets | Liabilities | Equity |
|---|---|---|
| Cash: $10,000 Accounts Receivable: $5,000 Inventory: $15,000 Equipment: $50,000 |
Accounts Payable: $8,000 Loans Payable: $20,000 |
Owner’s Equity: $57,000 |
Understanding Assets: What Is A Balance Sheet? Simple Explanation
Assets represent what a company owns and are the resources it controls as a result of past events and from which future economic benefits are expected to flow to the entity. The balance sheet categorizes assets into current and non-current assets based on their liquidity, or how quickly they can be converted into cash.
Assets are fundamental to understanding a company’s financial health. A strong asset base often indicates a company’s ability to generate revenue and meet its obligations. Conversely, a weak asset position might signal financial vulnerability. Analyzing the composition of a company’s assets provides valuable insights into its business model and its potential for future growth.
Current Assets
Current assets are resources expected to be converted into cash, sold, or used up within one year or the company’s operating cycle, whichever is longer. These assets are crucial for the company’s day-to-day operations and short-term financial stability. A healthy level of current assets is essential for meeting immediate obligations.
- Cash: This includes currency, bank balances, and readily available funds.
- Accounts Receivable: Money owed to the company by customers for goods or services sold on credit.
- Inventory: Goods held for sale in the ordinary course of business.
- Prepaid Expenses: Expenses paid in advance, such as insurance premiums or rent.
Non-Current Assets
Non-current assets, also known as long-term assets, are resources expected to benefit the company for more than one year. These assets represent the company’s long-term investment in its operations and future growth. They are typically less liquid than current assets.
- Property, Plant, and Equipment (PP&E): This includes land, buildings, machinery, and equipment used in the company’s operations. These assets are often depreciated over their useful lives.
- Intangible Assets: These are non-physical assets such as patents, copyrights, trademarks, and goodwill. These assets are often amortized over their useful lives.
- Long-term Investments: Investments in other companies or securities that are not expected to be sold within the next year.
Characteristics of Asset Types
The following table summarizes key characteristics of different asset types:
| Asset Type | Liquidity | Life Span | Valuation |
|---|---|---|---|
| Cash | High | Short-term | Face Value |
| Accounts Receivable | Moderate | Short-term | Net Realizable Value |
| Inventory | Moderate | Short-term | Lower of Cost or Market |
| Property, Plant, and Equipment | Low | Long-term | Historical Cost less Accumulated Depreciation |
| Intangible Assets | Low | Long-term | Amortized Cost |
Understanding Liabilities
Liabilities represent a company’s financial obligations—what it owes to others. Understanding liabilities is crucial for assessing a company’s financial health and its ability to meet its obligations. They are essentially the opposite of assets; while assets represent what a company owns, liabilities represent what a company owes. This section will clarify the nature of liabilities and categorize them for better understanding.
Liabilities are classified primarily as either current or non-current, depending on their due date. This distinction is important because it reflects the company’s short-term and long-term financial commitments.
Current Liabilities
Current liabilities are obligations due within one year or within the company’s operating cycle, whichever is longer. These are short-term debts that require immediate attention and management. Efficient management of current liabilities is vital for maintaining liquidity and avoiding financial distress. Examples include obligations that arise from the normal course of business operations.
Examples of current liabilities include accounts payable (money owed to suppliers for goods or services), salaries payable (unpaid wages to employees), short-term loans, and accrued expenses (expenses incurred but not yet paid, such as utilities or rent). The prompt payment of these liabilities is essential for maintaining positive relationships with suppliers and employees and for avoiding penalties or late fees.
Non-Current Liabilities
Non-current liabilities, also known as long-term liabilities, are obligations due beyond one year or the operating cycle. These represent longer-term financial commitments and are typically associated with significant capital investments or financing. Effective management of non-current liabilities involves careful planning and consideration of long-term financial strategies.
Examples of non-current liabilities include long-term loans, mortgages payable (loans secured by real estate), bonds payable (debt instruments issued to raise capital), and deferred tax liabilities (taxes owed but not yet payable). The management of these liabilities requires a long-term perspective, ensuring that the company has sufficient resources to meet its obligations as they mature.
Comparison of Current and Non-Current Liabilities
| Feature | Current Liabilities | Non-Current Liabilities |
|---|---|---|
| Maturity | Due within one year or operating cycle | Due beyond one year or operating cycle |
| Examples | Accounts payable, salaries payable, short-term loans, accrued expenses | Long-term loans, mortgages payable, bonds payable, deferred tax liabilities |
| Impact on Liquidity | Significant impact; affects short-term solvency | Less immediate impact; affects long-term solvency |
| Management Focus | Short-term financial planning and cash flow management | Long-term financial planning and capital structure |
Understanding Equity
Equity represents the owners’ stake in a company. It’s the residual interest in the assets of an entity after deducting its liabilities. In simpler terms, it’s what’s left over for the owners after all the company’s debts are paid. Understanding equity is crucial because it shows the financial health and value of a business from the owners’ perspective.
Equity is intrinsically linked to both assets and liabilities through the fundamental accounting equation: Assets = Liabilities + Equity. This equation always holds true; if one side changes, the other side must adjust to maintain balance. Assets are what a company owns (like cash, equipment, and buildings), liabilities are what a company owes (like loans and accounts payable), and equity is the difference between the two.
Retained Earnings and Contributed Capital
Retained earnings and contributed capital are the two primary components of equity. Contributed capital represents the money invested by shareholders in the company, typically through the purchase of stock. This is the initial investment made by the owners to start or expand the business. Retained earnings, on the other hand, represent the accumulated profits of the company that have not been distributed as dividends to shareholders. These profits are reinvested back into the business to fund growth or operations. The difference between the two highlights the sources of funding for the company – one from external investors (contributed capital) and one from internal operations (retained earnings).
Changes in Equity Over Time
Equity fluctuates based on several factors. Profits increase equity because they add to retained earnings. Conversely, losses decrease equity. Dividends, which are distributions of profits to shareholders, also reduce equity as they decrease retained earnings. For instance, if a company generates a profit of $100,000 and pays out $20,000 in dividends, its retained earnings increase by $80,000, thus increasing equity. Conversely, a loss of $50,000 would directly decrease equity by that amount. New investments by shareholders, such as issuing new stock, would increase contributed capital and therefore increase total equity.
The Accounting Equation Illustrated
Let’s illustrate the accounting equation with a few numerical examples.
Example 1: A company has assets of $500,000 and liabilities of $200,000. Using the equation (Assets = Liabilities + Equity), we can calculate equity: $500,000 = $200,000 + Equity. Therefore, Equity = $300,000.
Example 2: The company in Example 1 earns a profit of $50,000. This profit increases retained earnings, and consequently, equity. The new equity would be $350,000 ($300,000 + $50,000). Assets would also increase (perhaps through increased cash or other investments), maintaining the balance of the equation.
Example 3: The same company from Example 2 then pays out $10,000 in dividends. This reduces retained earnings and, therefore, equity. The new equity becomes $340,000 ($350,000 – $10,000). The decrease in retained earnings is reflected in a corresponding decrease in assets (e.g., lower cash balance). The accounting equation remains balanced.
Assets = Liabilities + Equity
Interpreting a Balance Sheet
A balance sheet, while a static snapshot of a company’s financial position at a specific point in time, offers valuable insights into its financial health. Analyzing a balance sheet involves more than just reviewing individual numbers; it requires understanding the relationships between different accounts and using key ratios to assess the company’s liquidity, solvency, and overall financial strength.
Analyzing a balance sheet involves a systematic approach to understanding the company’s financial position. This includes examining the relationships between assets, liabilities, and equity, and calculating key financial ratios to assess the company’s financial health. Careful interpretation, however, is crucial as a balance sheet alone doesn’t provide a complete picture.
Key Ratios for Balance Sheet Analysis
Several key ratios derived from the balance sheet provide valuable insights into a company’s financial health. These ratios help compare the company’s performance to its peers or to its historical performance. Understanding these ratios allows for a more comprehensive assessment of a company’s financial stability and risk profile.
- Current Ratio: This ratio measures a company’s ability to pay its short-term liabilities with its short-term assets. It is calculated as:
Current Assets / Current Liabilities
. A higher current ratio generally indicates better liquidity, but an excessively high ratio might suggest inefficient use of assets.
- Debt-to-Equity Ratio: This ratio indicates the proportion of a company’s financing that comes from debt versus equity. It’s calculated as:
Total Debt / Total Equity
. A higher ratio suggests higher financial risk, as the company relies more on borrowed funds.
- Quick Ratio (Acid-Test Ratio): This is a more stringent measure of liquidity than the current ratio, as it excludes inventories from current assets. It is calculated as:
(Current Assets – Inventories) / Current Liabilities
. This ratio provides a better understanding of a company’s ability to meet its short-term obligations without relying on the sale of inventory.
Limitations of Using a Balance Sheet in Isolation
While a balance sheet provides a valuable snapshot of a company’s financial position, it’s crucial to remember its limitations. A balance sheet alone doesn’t tell the whole story. For example, it doesn’t reflect the company’s profitability, cash flow, or future prospects. A complete financial analysis requires reviewing the balance sheet in conjunction with the income statement and cash flow statement to gain a holistic view. Furthermore, the balance sheet values are based on historical cost accounting, which may not reflect the current market value of assets.
Questions to Ask When Interpreting a Balance Sheet
Before drawing conclusions, it’s important to ask critical questions to gain a comprehensive understanding. These questions help to delve deeper into the data and identify potential concerns or strengths.
- What is the trend in the company’s current ratio over time? A declining trend might signal worsening liquidity.
- How does the company’s debt-to-equity ratio compare to its industry peers? A significantly higher ratio than industry averages could indicate higher risk.
- What is the composition of the company’s assets and liabilities? Are there any significant concentrations of risk?
- Are the company’s assets fairly valued, or are there any indications of impairment? Obsolete inventory or outdated technology might skew the picture.
- What are the company’s off-balance sheet financing arrangements? These can significantly impact the company’s true financial position.
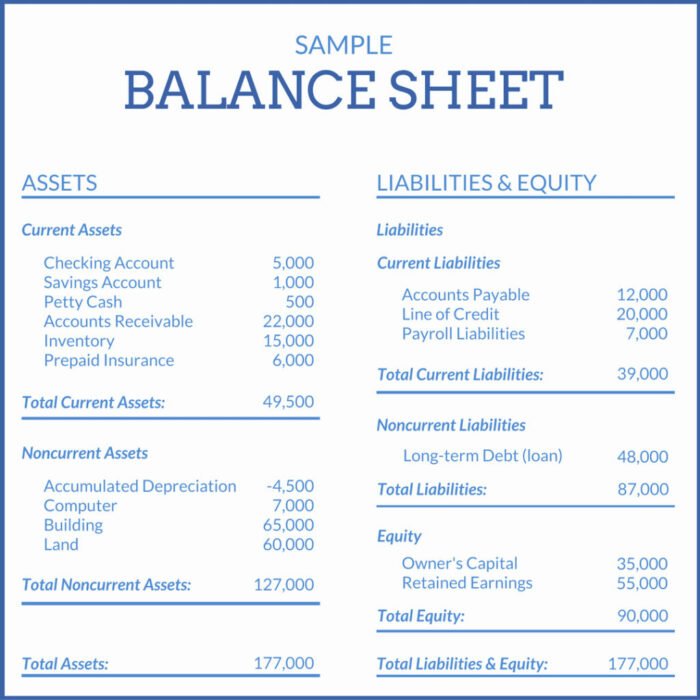
Illustrative Example
Let’s illustrate the balance sheet with a hypothetical small business: “Sarah’s Bakery.” This example will demonstrate how the different components of a balance sheet interact and provide a clear picture of the bakery’s financial health at a specific point in time.
Sarah’s Bakery has been operating for a year, and we’ll create a balance sheet as of December 31st. The values used are for illustrative purposes only and don’t represent real-world financial data.
Sample Balance Sheet for Sarah’s Bakery
The following balance sheet presents a snapshot of Sarah’s Bakery’s financial position. Each item is carefully explained to clarify its inclusion and calculation.
| Account | Amount ($) |
|---|---|
| Assets | |
| Cash | 5,000 |
| Accounts Receivable | 1,000 |
| Inventory (Flour, Sugar, etc.) | 2,000 |
| Equipment (Oven, Mixer) | 10,000 |
| Total Assets | 18,000 |
| Liabilities | |
| Accounts Payable | 3,000 |
| Loan Payable | 5,000 |
| Total Liabilities | 8,000 |
| Equity | |
| Owner’s Equity | 10,000 |
| Total Liabilities and Equity | 18,000 |
Detailed Explanation of Balance Sheet Entries, What is a Balance Sheet? Simple Explanation
The balance sheet demonstrates the fundamental accounting equation: Assets = Liabilities + Equity. In this example, Sarah’s Bakery’s total assets ($18,000) equal the sum of its total liabilities ($8,000) and equity ($10,000).
* Assets: These represent what Sarah’s Bakery owns. Cash is the readily available money. Accounts Receivable represents money owed to the bakery by customers. Inventory includes the raw materials needed for baking. Equipment represents the bakery’s ovens, mixers, and other tools.
* Liabilities: These are what Sarah’s Bakery owes to others. Accounts Payable is money owed to suppliers for goods purchased on credit. Loan Payable represents the outstanding balance on any loans taken out.
* Equity: This represents the owner’s stake in the business. It’s the residual value after subtracting liabilities from assets. In this case, Sarah’s initial investment and accumulated profits contribute to her equity. The equity figure reflects the net worth of the business from the owner’s perspective.
Last Word
In conclusion, understanding a balance sheet is essential for anyone interested in finance, whether you’re an investor, entrepreneur, or simply curious about how businesses operate. By grasping the core components – assets, liabilities, and equity – and learning how to interpret key ratios, you gain valuable insights into a company’s financial stability and potential. Remember that while the balance sheet offers a powerful snapshot, it’s most effective when considered alongside other financial statements for a holistic view. Armed with this knowledge, you can confidently navigate the world of financial statements and make more informed decisions.
FAQ Resource
What is the difference between a balance sheet and an income statement?
A balance sheet shows a company’s financial position at a specific point in time (assets, liabilities, equity), while an income statement shows its financial performance over a period (revenues, expenses, profit).
How often are balance sheets prepared?
Balance sheets are typically prepared at the end of each accounting period, which can be monthly, quarterly, or annually, depending on the company’s needs and reporting requirements.
Can a balance sheet be used to predict future performance?
While a balance sheet provides a snapshot of current financial health, it doesn’t directly predict future performance. However, trends and ratios derived from comparing balance sheets over time can offer insights into potential future performance.
What are some common errors found in balance sheets?
Common errors include misclassifying assets or liabilities, incorrect valuation of assets, and omissions of important items.
Discover how Best Payroll Software for Small Businesses has transformed methods in this topic.